


Retail shrinkage cost U.S. retailers an estimated 1.6% of sales in 2024, according to the National Retail Federation. For a $50 million location, that translates to $800,000 in preventable loss every year. Yet when loss prevention leaders request budget for technology upgrades, the conversation often stalls at the same question: Where's the business case?
The gap between knowing shrink is a problem and proving that a specific technology investment will pay for itself is where most proposals lose momentum. Finance teams want hard numbers. Operations leaders want assurance that new tools won't add complexity. And LP managers in the field need confidence that what they pilot will actually reduce their workload—not double it.
This article lays out a practical ROI framework for retail loss prevention software, covering the cost categories Finance will validate, the benchmarks that hold up in review, and a business case structure that supports fast approval.
Key terms for building a loss prevention business case
A few definitions anchor the ROI conversation and keep stakeholders aligned on what the numbers actually represent.
Term |
Definition |
Why it matters for ROI |
|---|---|---|
Shrinkage (shrink) |
The gap between recorded inventory and actual physical inventory, expressed as a percentage of sales |
The primary metric LP technology aims to reduce |
Cost per incident avoided |
Total annual incident-related costs divided by the number of incidents a new system helps eliminate |
Translates deterrence into dollars Finance can model |
Automated flagging of POS transactions that deviate from normal patterns (voids, discounts, refunds) |
Replaces hours of manual review with targeted investigation |
|
Loss prevention audit |
A structured assessment of inventory controls, transaction procedures, and physical security effectiveness |
Establishes the baseline shrink rate your business case builds from |
Retail shrink action plan |
A documented strategy outlining specific steps, timelines, and accountability for reducing shrinkage |
The operational roadmap that turns technology investment into measurable results |
Why traditional LP budgets face scrutiny
Loss prevention teams often compete for the same capital budget as store remodels, supply chain upgrades, and marketing programs. The hurdle isn't skepticism about shrink—it's skepticism about whether technology will move the needle enough to justify the spend.
Three dynamics make the approval process especially difficult:
Shrink is spread across multiple causes. Organized retail crime (ORC) accounts for roughly 36.5% of shrinkage, employee theft represents 28.6%, administrative errors contribute 24.0%, and customer-related losses make up 10.9% (NRF, 2024). No single tool addresses all four, so leaders must show how technology targets the highest-impact categories.
Investigation labor is invisible. LP managers and store leaders spend an estimated 15–25 hours per week on manual investigation, exception follow-up, and variance reconciliation (Retail Operations Council, 2025). That time rarely appears as a line item, making it hard to quantify what automation saves.
Deterrence is difficult to prove. Reducing incidents that didn't happen requires a measurement framework most organizations haven't built yet. Without one, the business case relies on anecdotes instead of data.
The four pillars of LP technology ROI
A credible business case rests on four quantifiable categories. Each one maps to a line item that Finance can validate and track over time.
1. Direct shrinkage reduction
This is the number the CFO will anchor on. Start with the baseline shrink rate established during your most recent loss prevention audit, then model conservative improvement scenarios.
Scenario |
Baseline shrink |
Reduction target |
Annual sales ($50M location) |
Annual recovery |
|---|---|---|---|---|
Conservative |
1.6% |
20% |
$50,000,000 |
$160,000 |
Moderate |
1.6% |
30% |
$50,000,000 |
$240,000 |
Aggressive |
1.6% |
40% |
$50,000,000 |
$320,000 |
Industry data suggests a 20–30% shrinkage reduction within 6–12 months of deploying comprehensive loss prevention software, with 25–40% achievable within 12–18 months as operational discipline matures (Loss Prevention ROI Study, 2024). A strong retail shrink action plan targets the 2% threshold as a benchmark for "well-controlled" performance—anything above that signals room for technology-driven improvement.
Tip: When building your shrinkage reduction model, always start with the conservative scenario (20% reduction) for executive presentations. Finance teams trust proposals that under-promise. You can share the moderate and aggressive scenarios as upside potential once the pilot data validates the conservative baseline.
2. Investigation and labor efficiency gains
Automated exception reporting and video-linked incident management reduce the hours LP teams spend on manual review. The savings scale across every location you roll out.
Metric |
Before automation |
After automation |
Savings per location/month |
|---|---|---|---|
Investigation hours/week |
15–25 hrs |
6–15 hrs |
36–40 hrs/month |
Cycle count time/month |
40 hrs |
24–28 hrs |
12–16 hrs/month |
Estimated labor cost saved |
— |
— |
$840–$1,750/month |
For a 10-location district, that translates to $100,000–$210,000 in annual labor reallocation. These aren't layoffs—they're hours shifted from scrubbing footage and reconciling variances to ORC pattern work and store-level coaching.
3. Guard cost offset and coverage expansion
Guard spend is one of the largest controllable line items in an LP budget. The question isn't whether guards add value—it's whether AI can extend perimeter coverage without adding headcount.
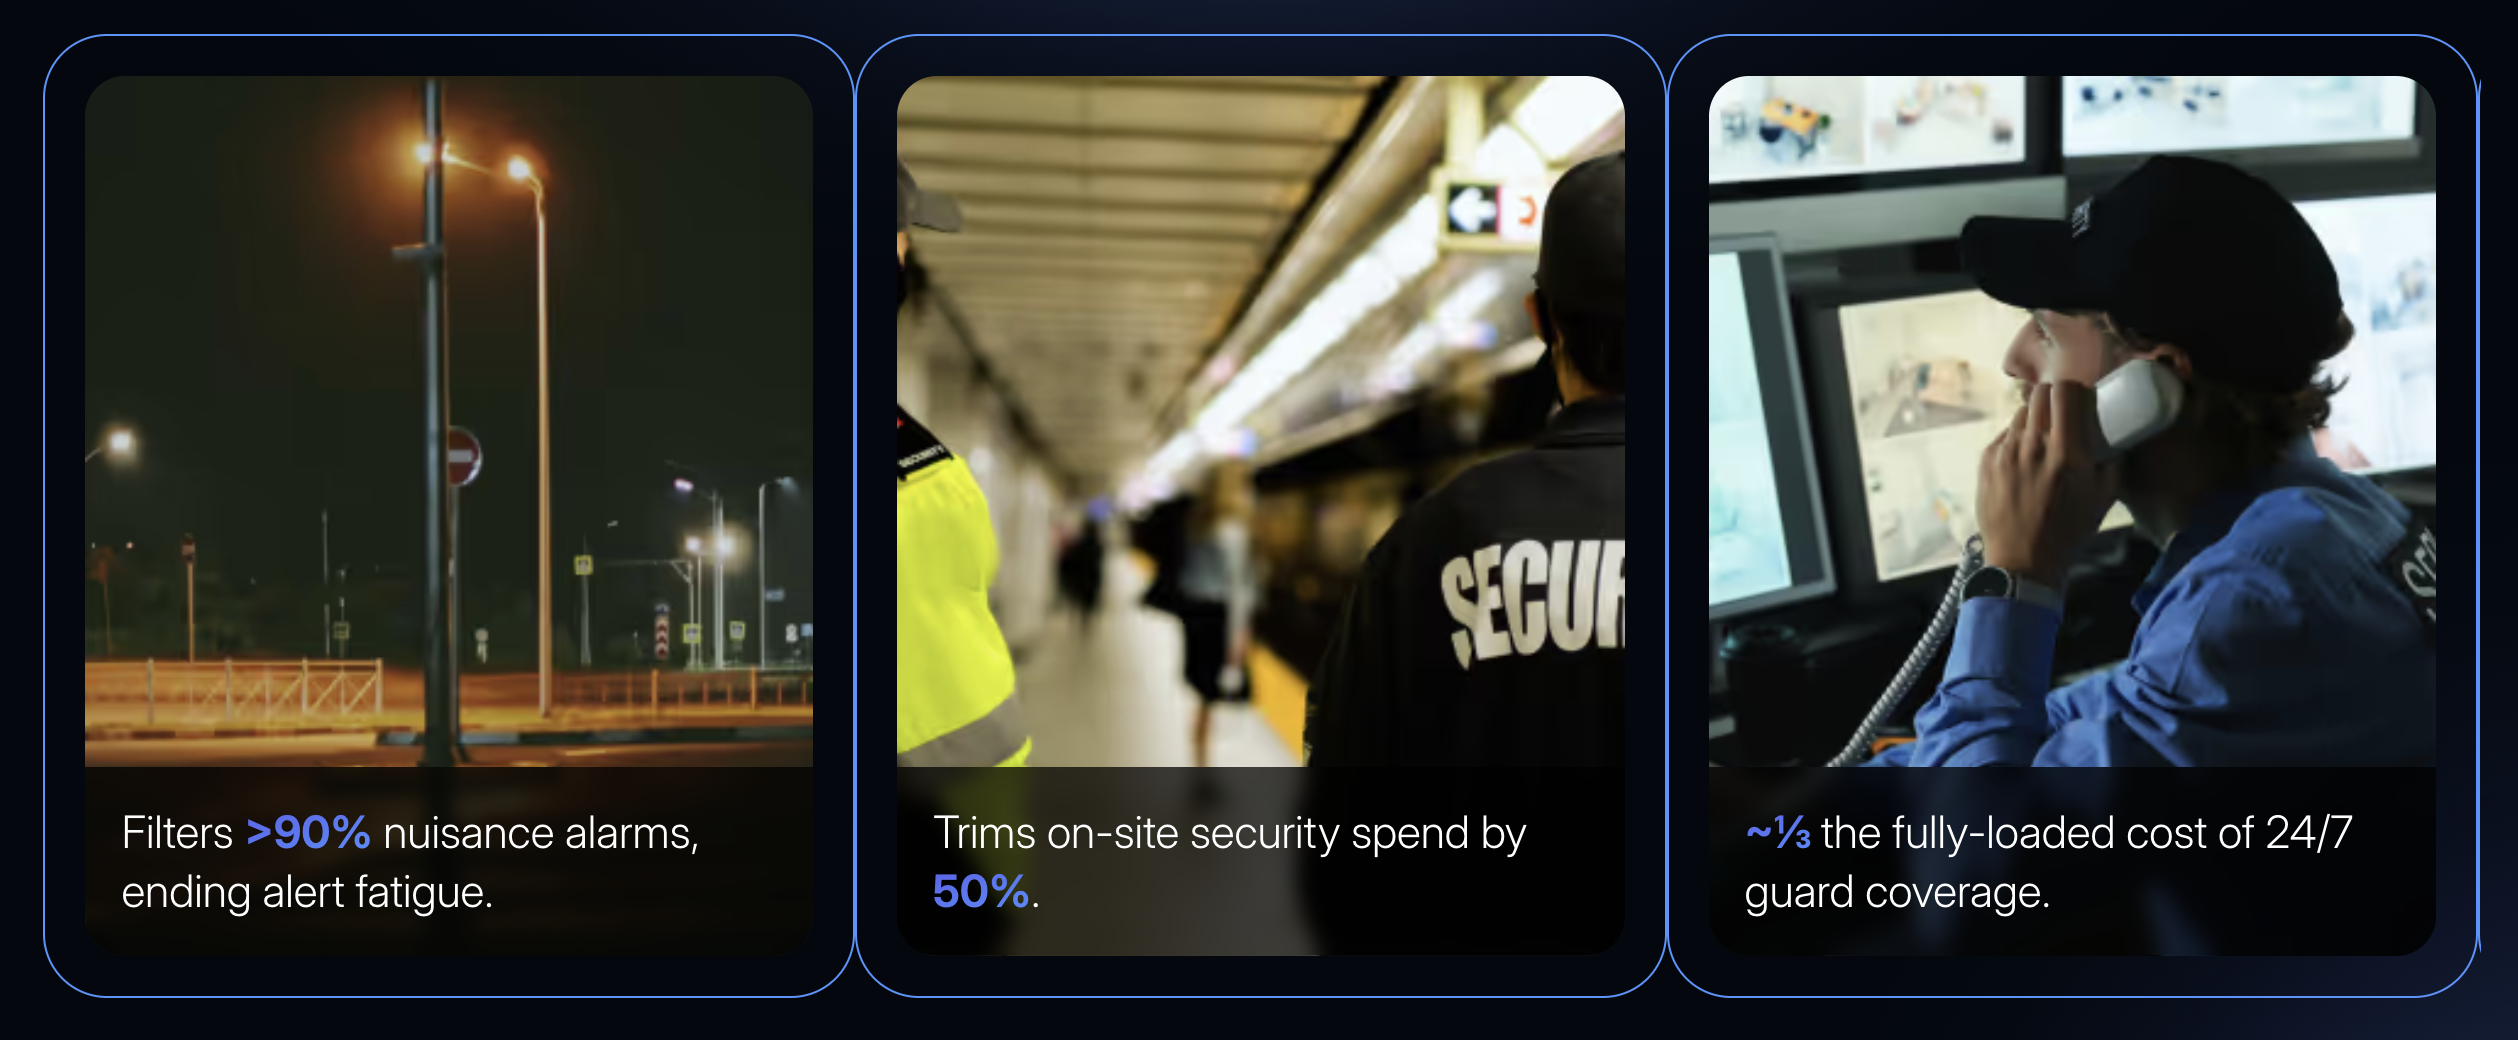
Spot AI positions its AI Security Guard at roughly one-third the fully loaded cost of 24/7 guard coverage. For teams managing 30–40 stores with limited field staff, the math shifts from "how many guards do we need?" to "how many locations can we cover with the same team?"
Key metrics to model in the business case:
Guard hours replaced per site per month — Track the shift hours where automated deterrence (strobes, voice-downs) handles after-hours incidents that previously required on-site personnel.
Cost per incident avoided — Divide total annual technology cost by the number of incidents reduced versus the prior-year baseline. This gives Finance a unit economics figure they can benchmark.
Alert-to-action rate — Measure what percentage of alerts result in a meaningful response. A high rate signals the system triages real threats rather than generating noise. Spot AI's AI Security Guard filters more than 90% of nuisance alarms, directly addressing the alert fatigue that causes field teams to disengage from monitoring tools.
4. Inventory accuracy and downstream revenue capture
Shrink doesn't just cost inventory—it degrades the accuracy of every downstream decision, from replenishment to markdown timing.
Impact area |
Mechanism |
Estimated annual value ($50M location) |
|---|---|---|
Carrying cost reduction |
5–8% less excess stock through better variance identification |
~$36,000 |
Stockout recovery |
50% fewer stockouts in high-shrink categories |
$250,000–$350,000 in incremental revenue |
Markdown reduction |
25% fewer forced markdowns from overstock/aging |
$93,750–$125,000 |
These figures come from improved inventory accuracy, not from the LP software alone. But the business case strengthens considerably when you show how shrink reduction cascades into merchandising and margin improvements (Inventory Accuracy and Sales Impact Study, 2024).
Structuring the business case document
A business case that earns approval follows a predictable structure. Tailor the emphasis based on whether the primary audience is the CFO (cost avoidance), COO (operational efficiency), or VP of LP (risk posture and scalability).
Executive summary — State the problem in one paragraph: current shrink rate, annual dollar impact, and the gap between current controls and target performance.
Baseline metrics — Document pre-implementation shrink rates by department and location, investigation hours per week, guard spend, and incident frequency. Pull these from your most recent loss prevention audit.
Solution overview — Describe the technology category (video AI, EBR, incident management) and how it integrates with existing POS, inventory, and video systems. Emphasize deployment speed and minimal disruption.
ROI model — Present the four-pillar framework above with conservative, moderate, and aggressive scenarios. Use a 12–18 month payback window.
Pilot plan — Propose a 30/60/90-day pilot at 2–3 high-shrink locations. Define what gets measured: incident counts, after-hours events, response time, review time saved, and guard hours avoided.
Risk mitigation — Address adoption risk (store leader buy-in), integration risk (compatibility with existing systems), and measurement risk (how you'll isolate the technology's impact from other variables).
What All Star Elite's results reveal about measurable ROI
All Star Elite, a multi-location sports apparel retailer with 80 U.S. stores, deployed Spot AI's unified video platform for loss prevention and operations optimization. The results illustrate what a well-executed retail shrink action plan looks like in practice:
Cash shrink dropped from approximately 6% to 1%—an 83% reduction.
Merchandise shrink fell from 10–15% to roughly 6%, a significant decrease in inventory loss.
Investigation efficiency improved by more than 50%, with incident resolution moving from hours to minutes through centralized case management and AI-powered search.
Law enforcement case timelines compressed from 2–3 months to approximately 1 month, enabled by faster evidence packaging.
Store-level analytics contributed to 5–15% sales increases from optimized product placement and helped the retailer proactively close three underperforming stores before they accumulated further losses.
Read the full All Star Elite case study for details on their deployment approach.
Considerations before selecting LP technology
No technology investment is without trade-offs. A few factors deserve honest assessment before committing budget:
Integration complexity varies. Confirm that any platform connects to your existing POS, inventory management, and video infrastructure through standard APIs. Proprietary lock-in increases long-term cost and limits flexibility.
Adoption determines outcomes. The most capable retail loss prevention software delivers nothing if store teams ignore it. Prioritize solutions with low-friction workflows and visible deterrence that builds confidence at the store level.
Measurement requires discipline. Isolating technology's impact from seasonal trends, staffing changes, and external factors takes rigorous before-and-after tracking. Build the measurement plan before the pilot starts, not after.
Scalability isn't automatic. A solution that works at three pilot locations may hit infrastructure or support bottlenecks at 50. Evaluate cloud-native architecture and camera-agnostic compatibility early in the selection process.
Key takeaways for LP technology selection:
- Prioritize camera-agnostic, cloud-native platforms that integrate with your existing POS and video infrastructure via standard APIs.
- Build your measurement plan and baseline metrics before the pilot begins—not after—to isolate the technology's true impact.
- Evaluate store-level adoption friction early; the best technology delivers zero ROI if field teams don't use it.
Turning pilot metrics into an executive narrative
The business case doesn't end at approval. The pilot phase generates the data that either accelerates rollout or stalls it. Structure pilot reporting around the metrics that matter most to each stakeholder:
Stakeholder |
Primary metric |
Secondary metric |
|---|---|---|
CFO / Finance |
Cost per incident avoided |
Guard spend reduction |
COO / Operations |
Investigation hours saved |
Inventory accuracy improvement |
VP of LP |
Incident rate reduction (% vs. baseline) |
Alert-to-action rate |
District LP Manager |
Review time per incident |
Repeat activity reduction |
Frame the rollout recommendation around a standardized "perimeter control playbook" that applies the pilot's configuration, alert thresholds, and response protocols to locations with similar risk profiles. This gives Finance a repeatable cost model and gives field teams a deployment they can trust.
Build the case with data, not assumptions
The difference between a business case that gets funded and one that gets tabled is specificity. Anchor every claim in auditable baseline data. Model scenarios conservatively. And give decision-makers a pilot path that produces measurable results within 90 days.
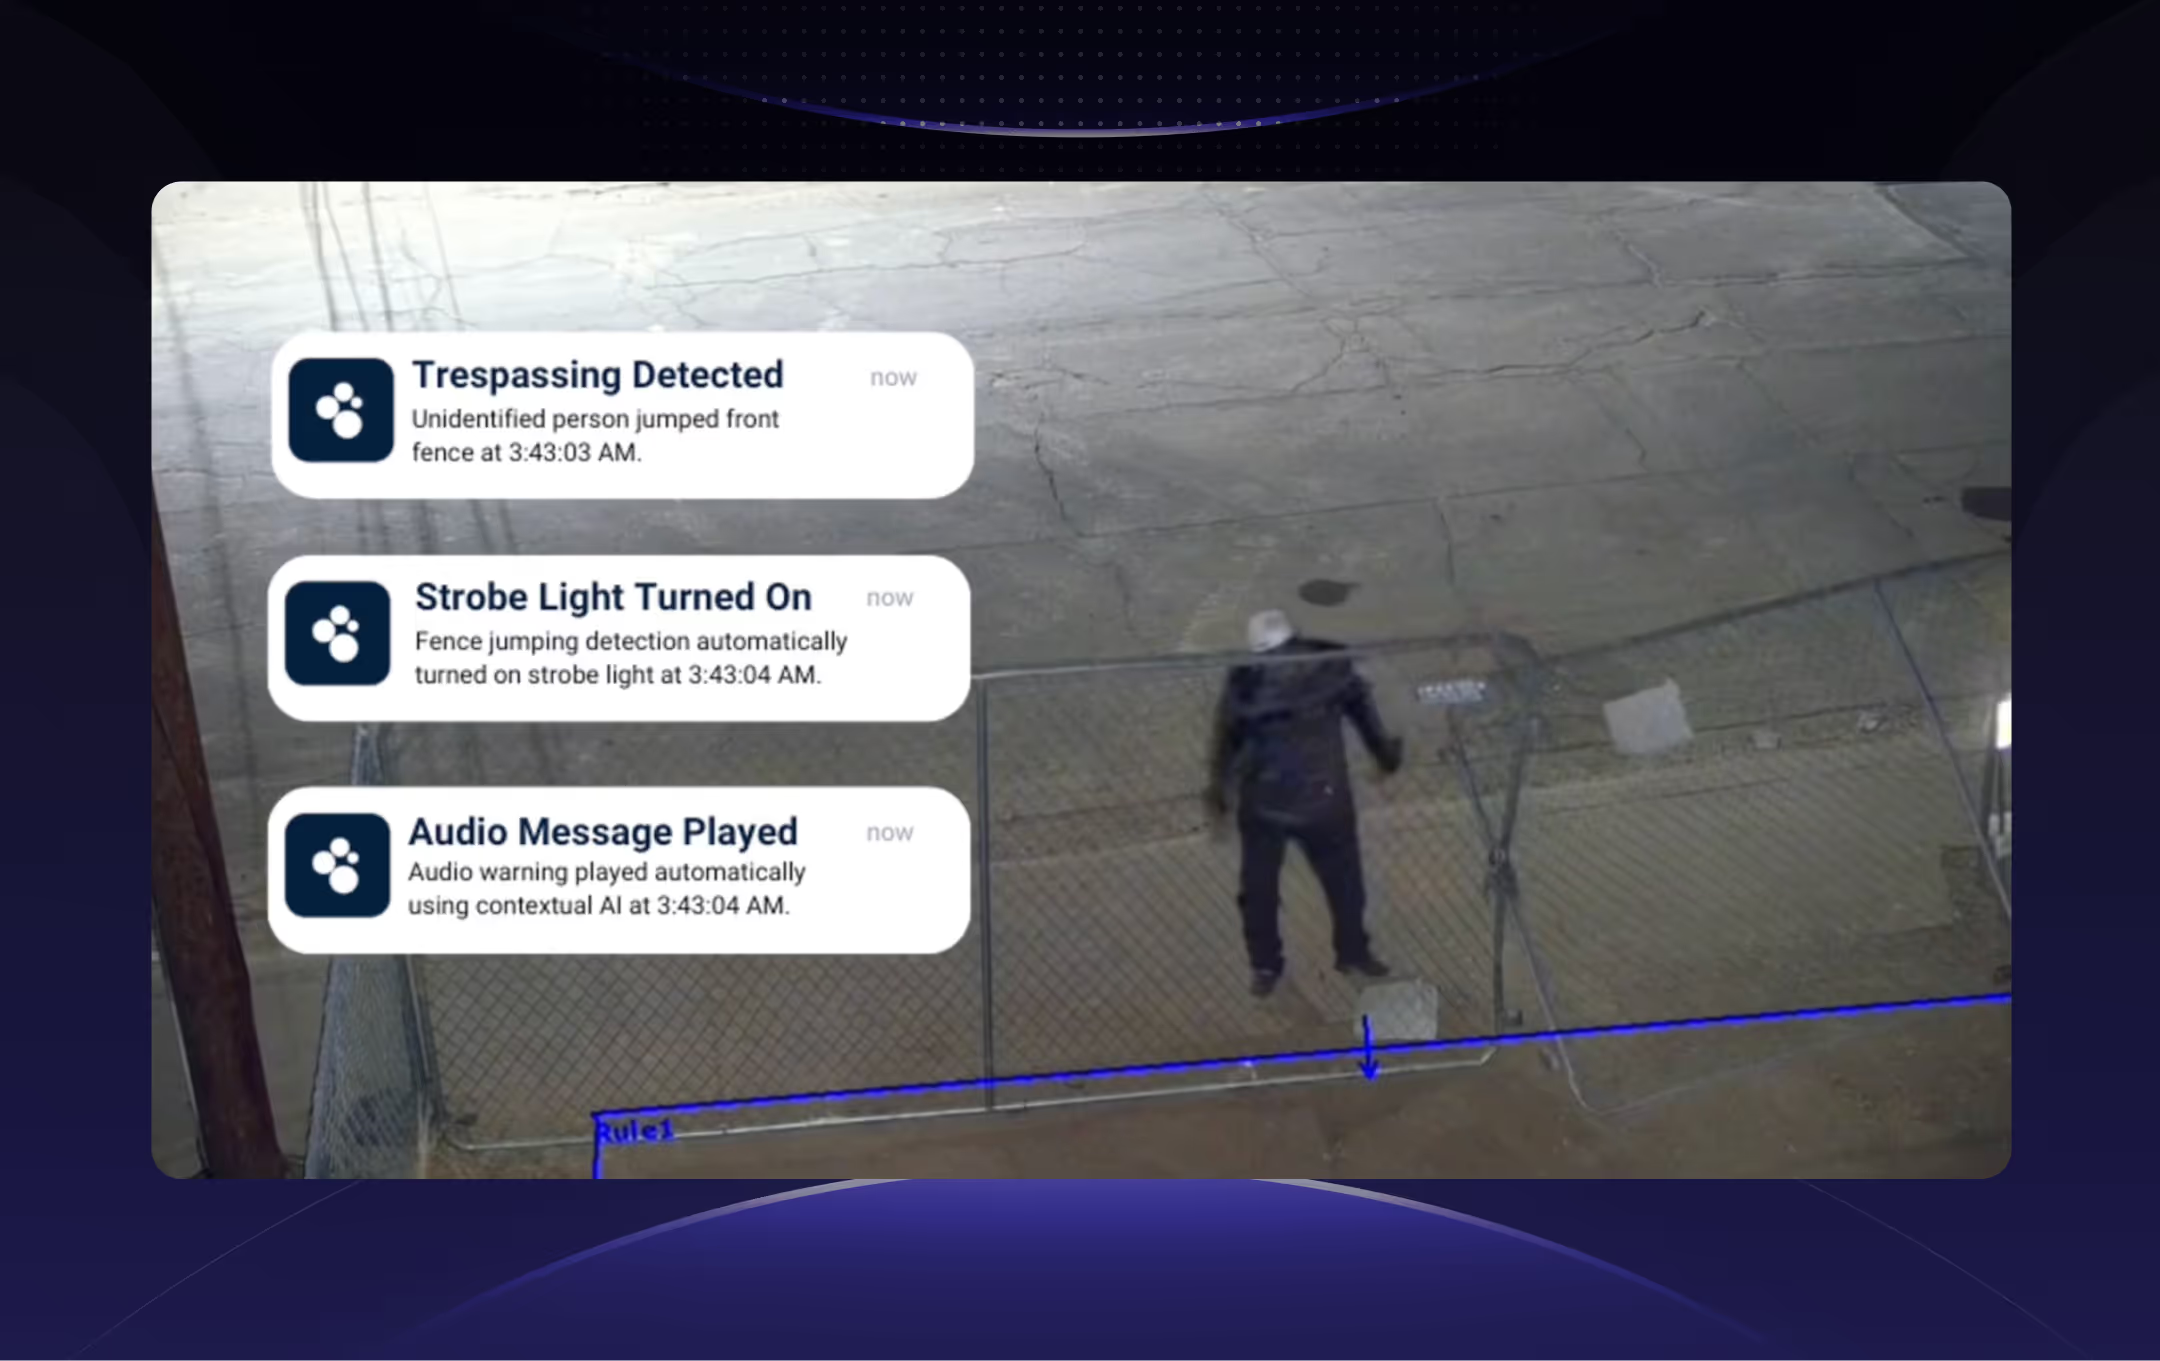
Spot AI's platform works with existing cameras, deploys in under a week, and delivers a unified dashboard where AI Security Guard detects and deters real threats and packages time-stamped evidence for faster case closure. For teams covering dozens of locations with limited staff, it acts as a digital force multiplier—extending coverage without extending payroll.
See Spot AI in action

Ready to evaluate impact across your locations? Request a demo to see how Spot AI supports shrink reduction, faster investigations, and broader coverage with video AI.
"Spot AI has replaced all of our legacy systems and enables us to view and review all of our sites from one central location. And with cheaper costing than our on-site analog DVR systems, it was an easy choice to go with Spot AI."
Daniel A., Systems and Programs Coordinator (G2)
Frequently asked questions
What are the best loss prevention software options for retail?
The strongest retail loss prevention software platforms combine video analytics, exception-based reporting, and centralized incident management in a single dashboard. Look for solutions that integrate with your existing POS and video infrastructure, offer cloud-based access across locations, and deliver context-aware alerts rather than simple motion detection. Camera-agnostic compatibility is critical—it protects your existing hardware investment and avoids vendor lock-in.
How can businesses effectively reduce shrinkage?
Effective shrinkage reduction requires a coordinated retail shrink action plan that addresses all four loss categories: ORC, employee theft, administrative errors, and customer-related losses. Technology plays a role in each—automated EBR catches transaction anomalies, video analytics flag unauthorized merchandise movement, and mobile cycle counting minimizes administrative errors compared to manual, paper-based processes. The common thread is pairing technology with operational discipline and clear accountability.
What is the average shrink rate in retail?
The average U.S. retail shrinkage rate is approximately 1.6% of sales, though rates vary by merchandise category and the strength of operational controls (NRF, 2024). Many organizations benchmark "strong performance" at or below 2%. Rates above that threshold typically indicate opportunities for technology-driven improvement, particularly in high-risk departments.
How do loss prevention audits work?
A loss prevention audit assesses the effectiveness of inventory controls, transaction procedures, and physical security across a location. Auditors review cash handling variance reports, inventory adjustment logs, exception transaction data, and video system functionality. The audit produces a control effectiveness score and identifies specific gaps. Best practice calls for risk-based scheduling, where locations with higher historical loss rates undergo more frequent comprehensive audits than lower-risk sites.
What ROI can retailers expect from loss prevention technology?
Conservative industry expectations point to a 20–30% shrinkage reduction within 6–12 months of implementing comprehensive LP technology. For a $50 million location at 1.6% baseline shrink, a 30% reduction recovers approximately $240,000 annually. When combined with investigation labor savings, guard cost offsets, and inventory accuracy improvements, total ROI often exceeds the technology investment within the first 12–18 months.
About the author
Sud Bhatija is COO and Co-founder at Spot AI, where he scales operations and GTM strategy to deliver video AI that helps operations, safety, and security teams boost productivity and reduce incidents across industries.


.png)
.png)
.png)
.svg)