


A single loss prevention professional responsible for 30 or more retail locations faces a math problem that no amount of hustle can solve. Even visiting one store per day leaves dozens of sites without direct oversight on any given week. Meanwhile, shrinkage across the retail industry continues to climb, with external theft, internal fraud, administrative errors, and vendor discrepancies all contributing to revenue leakage that compounds across a large portfolio.
The question isn't whether LP teams need broader coverage—it's how to achieve it without proportionally scaling headcount. Video AI offers a practical answer: one dashboard, prioritized incident alerts, and district-wide trend rollups that help LP teams cover more ground without adding headcount. This guide breaks down how that works in practice, from foundational loss prevention principles to phased deployment across a multi-store district.
Key terms for retail loss prevention
Before mapping the technology to the workflow, a few definitions ground the conversation:
Term |
Definition |
|---|---|
Shrinkage (shrink) |
The total dollar value lost to theft, fraud, errors, and waste—typically expressed as a percentage of revenue |
Exception-based reporting (EBR) |
Automated flagging of POS transactions that fall outside normal parameters (excessive voids, high-value refunds, manager overrides) |
Organized retail crime (ORC) |
Coordinated theft operations where groups target multiple stores, often reselling stolen goods |
Alert fatigue |
The operational breakdown that occurs when too many low-value or false alarms cause teams to stop trusting—or responding to—notifications |
Video AI |
Artificial intelligence applied to camera footage to detect, classify, and act on events without requiring a human to watch every feed |
Context-aware detection |
AI that evaluates multiple objects and situational factors before deciding whether an event warrants an alert |
Why covering 30+ stores with traditional methods falls short
Retail loss prevention has historically relied on a combination of physical store visits, manual footage review, and reactive investigation after inventory counts reveal discrepancies. For professionals managing a district of 20 to 40 or more locations, several structural limitations make this approach increasingly difficult to sustain.
Coverage gaps are built into the model
One person cannot physically monitor parking lots, perimeters, loading docks, and transaction zones across dozens of stores. High-risk areas—particularly outside the store's line of sight—are often where problems begin. After-hours trespassing, loitering in parking areas, and unauthorized access to receiving docks all happen when no one is present to observe them.
Investigations consume disproportionate time
When an incident does surface, the review process is slow. Scrubbing disconnected video systems across multiple locations to reconstruct a timeline can take hours. That delay undermines case quality, slows escalation to law enforcement, and pulls LP professionals away from higher-value work like trend analysis and prevention strategy.
Deterrence is inconsistent across locations
Traditional cameras feel passive to bad actors who assume no one is actively watching. Guard coverage is expensive and difficult to maintain uniformly across a large portfolio. The result is an uneven deterrence posture—some stores feel well-protected while others become soft targets.
Alert noise overwhelms workflows
Basic motion-triggered alerts generate a flood of non-events: wind, headlights, shopping carts, animals. When the signal-to-noise ratio is poor, teams either stop trusting alerts entirely or spend their limited time triaging irrelevant notifications instead of investigating real threats.
How a loss prevention system works with video AI across a district
A well-configured video AI platform addresses these pain points by shifting LP from after-the-fact review to proactive perimeter and store-floor response from one place. Here is how the core workflow functions across 30+ locations:
Centralized dashboard for multi-store visibility
Rather than logging into separate systems at each store, LP teams access a single cloud-based dashboard that aggregates feeds, alerts, and incident data from every location. This centralized hub model means one district team can keep tabs on all sites without staffing each store with dedicated security.
The dashboard surfaces what matters: active alerts ranked by severity, trend data across the portfolio, and time-stamped clips tied to specific events. Instead of watching every camera feed, LP professionals review the events the system has already filtered and prioritized.
Automated incident alerts with priority scoring
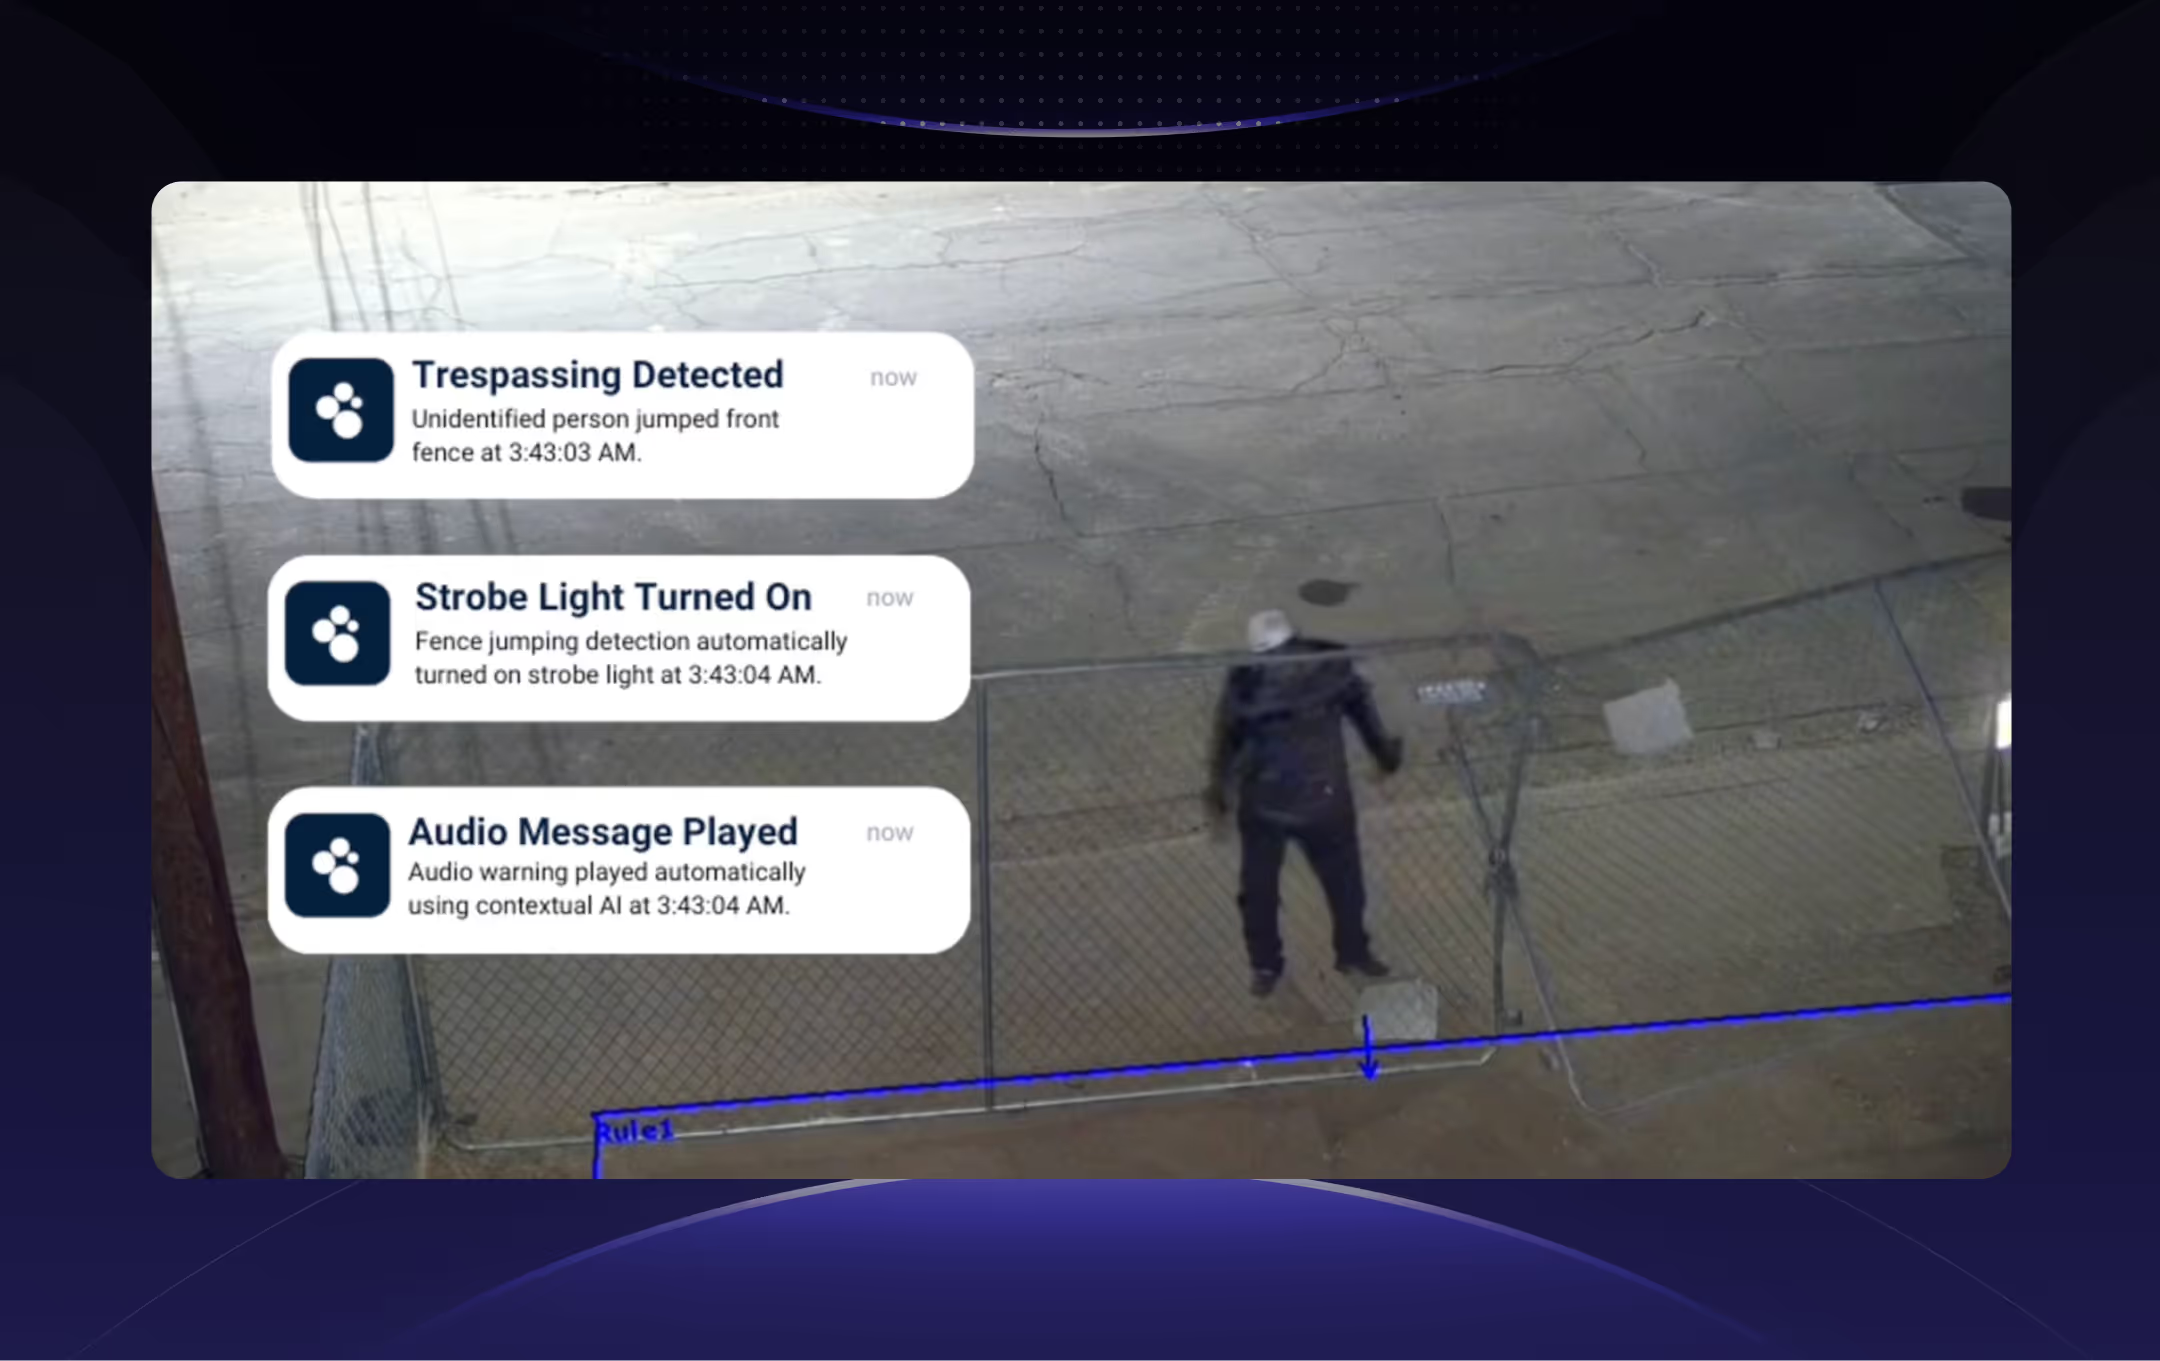
Video AI replaces basic motion detection with context-aware detection that flags what matters and ignores the rest. The system distinguishes between a delivery driver and an unauthorized person in a restricted area. It identifies loitering in parking lots, tailgating at secure entrances, and crowding at checkout zones—then generates alerts calibrated to severity.
A practical alert hierarchy looks like this:
Priority level |
Example triggers |
Response expectation |
|---|---|---|
High |
Unauthorized entry to restricted area, merchandise concealment at checkout, after-hours perimeter breach |
Rapid review and action within minutes |
Moderate |
Cashier with elevated void rates, repeated returns by same individual, loitering near high-value merchandise |
Next-shift review with investigation if pattern persists |
Low |
Queue length exceeding threshold, foot traffic anomalies, employee movement inefficiencies |
Weekly trend analysis and operational adjustment |
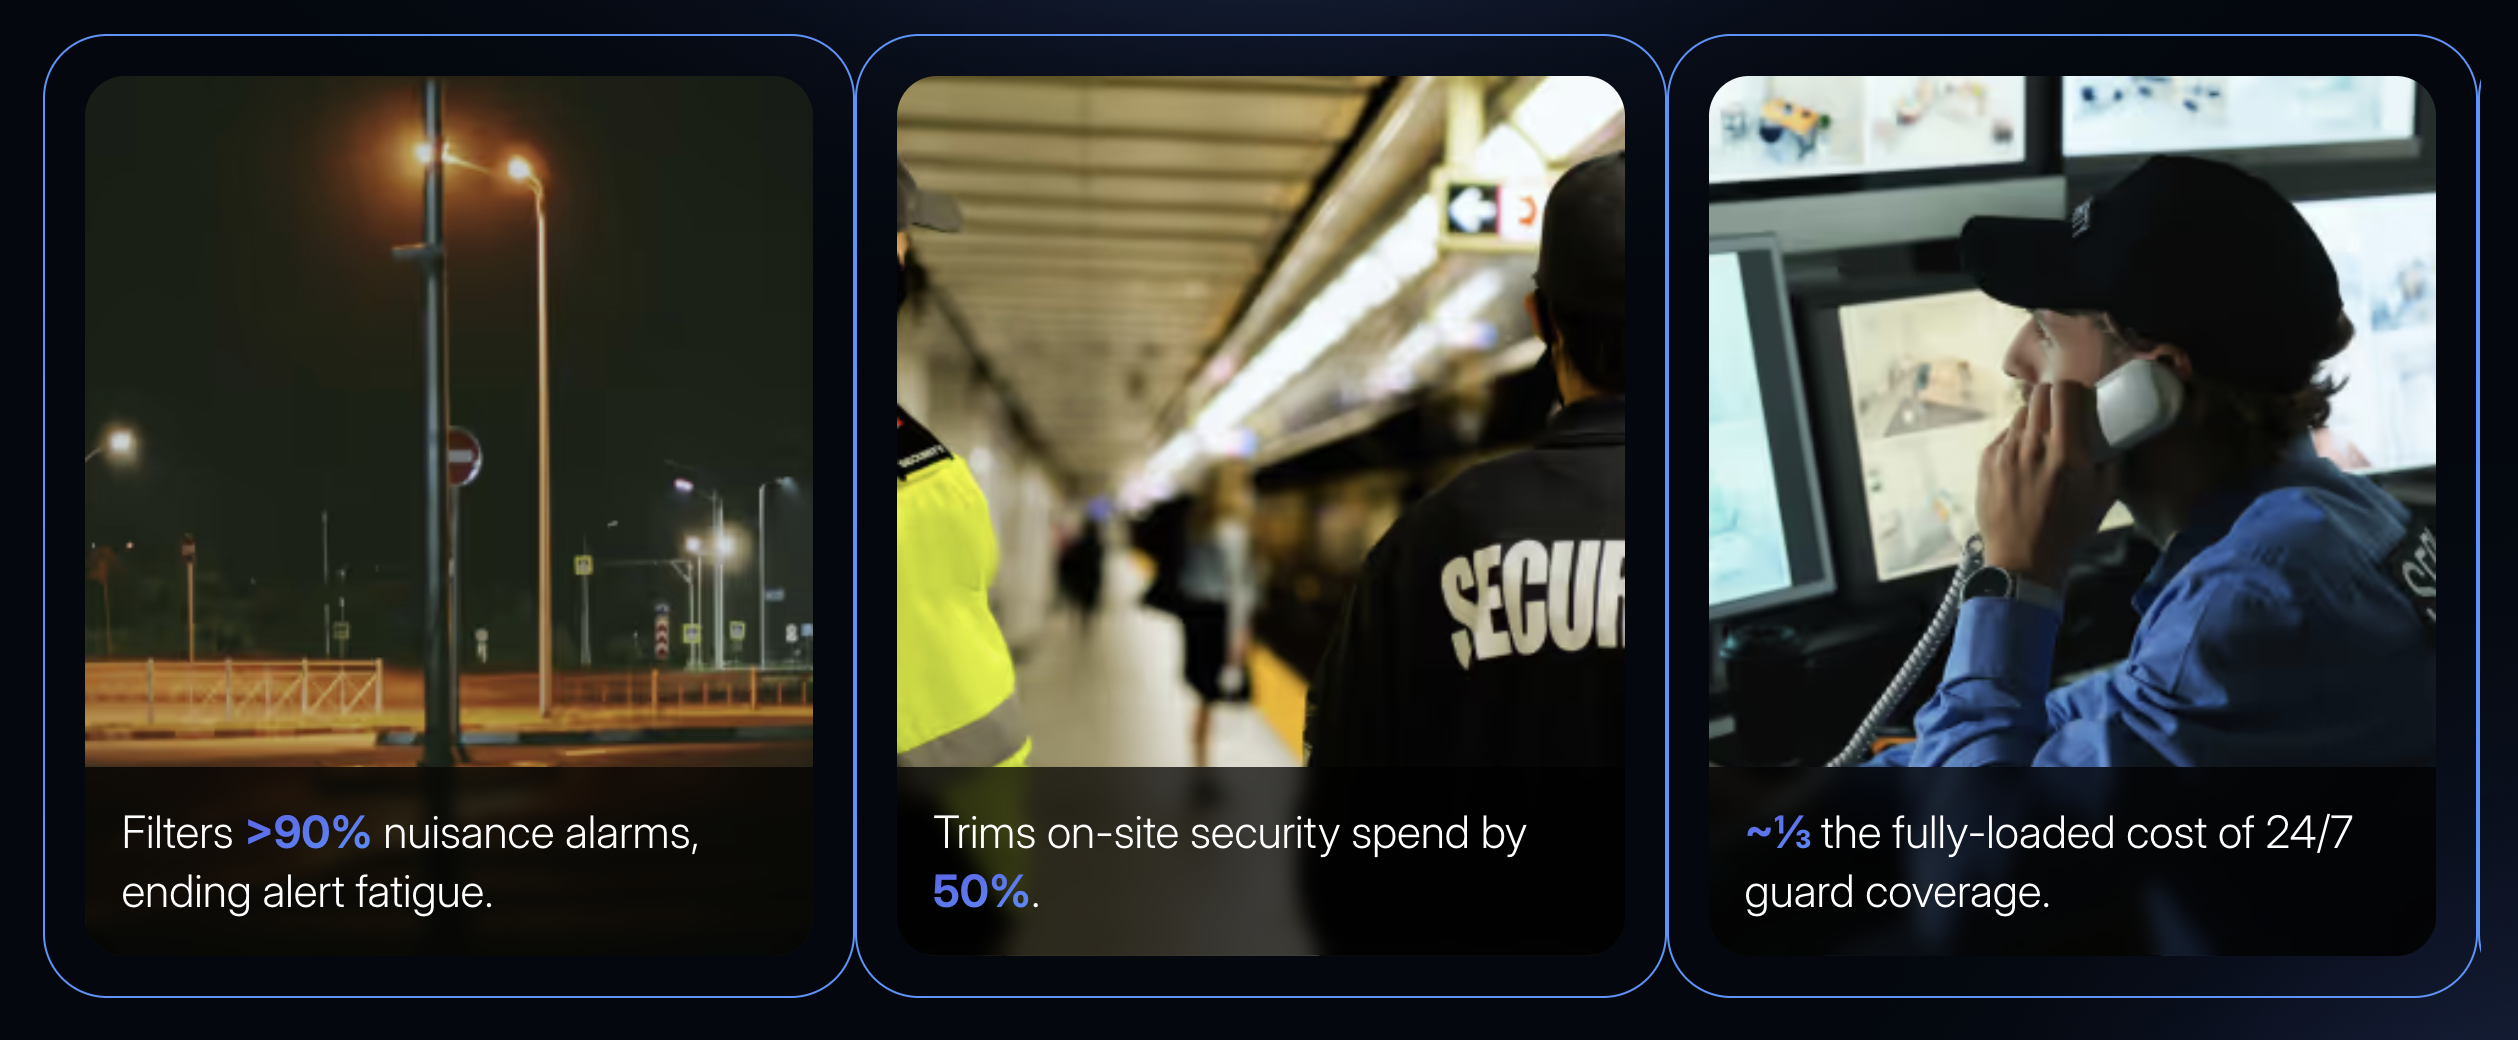
This tiered approach reduces alert fatigue by filtering out nuisance alarms and surfacing verified events that require human judgment. Well-tuned systems filter out the noise, freeing LP teams to focus on incidents that actually matter.
Tip: When configuring alert priority levels, start with a broader set of high-priority triggers and narrow them over time. It's easier to reduce alert volume after you understand your environment than to retroactively catch events you initially filtered out. Involve store managers in the tuning process—they often know which areas and behaviors are most problematic at their specific location.
Regional trend rollups for data-driven store visits
When you can't visit every store every week, the question becomes: which stores need attention first? Video AI answers this by aggregating incident data across the district and identifying patterns.
If three locations show coordinated theft of the same merchandise category within one week, that signals possible ORC activity requiring a coordinated response. If one store's shrinkage metrics are trending upward while peers remain stable, that location moves to the top of the visit list. Regional trend rollups turn scattered incidents into a clear store-by-store priority map.
Building a retail loss prevention strategy around AI-powered video
Deploying video AI across a multi-store district isn't a single technology decision—it's an operational strategy. The following framework outlines how LP teams can structure the rollout for maximum impact.
Step 1: establish a shrinkage baseline by location
Before any technology goes live, document current shrinkage across all managed locations with attribution by loss vector. This baseline—broken down by external theft, internal theft, administrative errors, and vendor discrepancies—creates the measuring stick for improvement.
Step 2: select pilot locations strategically
Pilot stores should meet several criteria:
High shrinkage history, which maximizes the opportunity to demonstrate measurable improvement
Supportive store management willing to engage with new workflows and alert response protocols
Adequate network infrastructure to support video transmission
Representative layouts and customer demographics that reflect the broader portfolio
A pilot phase of 8 to 12 weeks gives the system enough time to collect baseline alert data, tune detection thresholds, and document operational procedures before broader rollout.
Step 3: configure detection models for your environment
Generic AI models trained on other retailers' footage may not accurately identify loss patterns specific to your store layouts, merchandise mix, or customer base. Initial deployment should collect two to four weeks of baseline footage for model calibration.
Alert thresholds should start conservative—accepting a higher false-positive rate to ensure no genuine loss events are missed. As the model's accuracy improves over the first several months, thresholds tighten and alert volume drops. Over time, the system learns the specific environment, significantly reducing false positives and ensuring teams only review high-confidence events.
Step 4: integrate with POS and inventory systems
Video-only monitoring without transaction integration is less efficient than a connected system. When POS data flows into the video AI platform, flagged transactions—voids above a threshold, excessive refunds, manager overrides—are automatically linked to the corresponding video footage. This eliminates the manual process of matching timestamps and searching through hours of recordings.
Inventory system integration adds another layer: when cycle counts reveal discrepancies in a specific merchandise category, LP teams can pull the matching video window and zone to pinpoint the loss vector.
Step 5: scale across the district in phases
After a successful pilot, expand to five to eight additional locations representing different store sizes and formats. Use pilot documentation to standardize camera placement, AI configurations, and alert routing. Remaining locations roll out over the following six to 12 months, with each wave building on lessons from the previous phase.
Rollout phase |
Locations |
Duration |
Primary objective |
|---|---|---|---|
Pilot |
2–3 high-shrink stores |
8–12 weeks |
Validate system, tune models, document procedures |
Early adopter |
5–8 diverse formats |
Weeks 12–20 |
Confirm scalability, standardize configurations |
Broad rollout |
Remaining locations |
6–12 months |
Full district coverage with minimal customization |
How Storage Asset Management centralized monitoring across 50 locations
Storage Asset Management, which operates approximately 50 virtually managed, unstaffed storage facilities, deployed Spot AI to centrally monitor sites remotely rather than relying on on-site staff. The deployment shifted their security posture from reactive video review to active monitoring, using automated alerts for after-hours access and a centralized dashboard to navigate and oversee multiple locations.
In one documented incident, the system detected intruders at 1 AM and enabled direct notification to local law enforcement. Police arrived during the crime, and the facility reported a complete elimination of subsequent break-ins after the arrest was publicized. The solution integrated with existing camera infrastructure—no new hardware required—and included AI detections for loitering and vandalism, plus perimeter monitoring capabilities.
For LP professionals managing distributed locations, this case illustrates the core value proposition: one team, one dashboard, dozens of sites covered around the clock. You can read the full Storage Asset Management case study for additional detail.
What to consider before deploying video AI for loss prevention
Every rollout comes with trade-offs. LP teams evaluating video AI for multi-store coverage should account for several practical considerations:
Network bandwidth requirements. High-quality video transmission for multiple cameras per store requires adequate upload capacity. Many retail locations may need network upgrades before deployment to ensure smooth cloud connectivity.
Model tuning takes time. AI detection accuracy improves with exposure to site-specific footage. Expect the first four to six weeks to involve higher alert volumes and more manual review as the system learns normal patterns.
Human review remains essential. Video AI surfaces events and prioritizes them, but human judgment drives investigation decisions, escalation, and corrective action. The technology augments LP teams—it does not replace them.
Store-level buy-in matters. Store managers who understand how the system benefits their daily operations—faster incident response, objective documentation, operational efficiency data—are more likely to follow alert response protocols and support the program.
Ongoing optimization is required. Alert thresholds, camera placement, and detection models should be refined based on operational experience. Seasonal adjustments (holiday theft patterns, for example) keep the system calibrated to current risk.
Key takeaway: A successful multi-store video AI deployment depends as much on organizational readiness as on the technology itself. Prioritize store-level buy-in, plan for a model tuning period of four to six weeks, and build seasonal recalibration into your ongoing operations. The strongest LP programs treat video AI as a continuously improving system, not a one-time installation.
Measuring loss prevention effectiveness across a district
LP teams need clear metrics to demonstrate impact and justify continued investment. The following KPIs map directly to the outcomes that matter most for multi-store operations:
KPI |
What it measures |
Target benchmark |
|---|---|---|
Shrinkage rate by location |
Dollar loss as a percentage of revenue at each store |
Track monthly vs. prior year and peer average |
Alert-to-investigation ratio |
Total alerts generated vs. investigations conducted |
A balanced ratio indicates a well-tuned system avoiding alert fatigue |
Time-to-detect |
Elapsed time from event occurrence to first alert |
Seconds to minutes for high-priority events |
Investigation closure rate |
Percentage of flagged incidents resulting in documented findings |
Higher rates indicate effective operational processes |
Response time variance by location |
Consistency of alert response across the district |
Low variance signals standardized execution |
These metrics serve a dual purpose: they guide operational improvement and they build the internal business case that LP professionals need when presenting results to senior leadership.
Extend your district coverage with Spot AI
Spot AI connects to your existing cameras across every store location and brings alerts, time-stamped clips, and incident history into one cloud dashboard. The AI Security Guard filters out everyday motion, flags higher-risk activity, and can trigger automated deterrents like strobes and voice-downs, so teams can respond faster and document what happened. For LP teams covering 30 or more stores, this expands coverage without adding headcount.
The system deploys fast—often live in under a week—and works with existing IP cameras, so there's no rip-and-replace. Request a demo to see how Spot AI supports district-wide loss prevention workflows.
See Spot AI in action

"We can't be everywhere at once. That's where technology becomes crucial - it's not about replacing people, it's about augmenting our capabilities to keep everyone safe."
Kevin, Unique Industries — Source: Spot AI Customer Story
Frequently asked questions
What does loss prevention mean in retail?
Loss prevention encompasses all strategies, systems, and personnel designed to reduce shrinkage—the revenue lost to theft, fraud, administrative errors, and operational inefficiencies. For multi-store operations, it functions as a proactive system that uses data collection, analysis, and intervention protocols to identify and address revenue leakage as it occurs, rather than exclusively investigating after the fact.
What are the most effective methods of loss prevention?
The most effective programs combine multiple layers: transaction monitoring automation that flags anomalies at the point of sale, video AI that detects suspicious behavior and unauthorized access in real time, process compliance audits for cash handling and receiving, and employee training that builds awareness of common loss patterns. For district-level operations, centralized monitoring across all locations through a unified dashboard delivers the broadest impact per LP team member.
How do loss prevention systems work?
A modern retail loss prevention system integrates video technology with POS data, inventory records, and access control logs. Video AI analyzes camera feeds to detect specific events—merchandise concealment, unauthorized area access, loitering, transaction anomalies—and generates prioritized alerts. These alerts route to LP personnel based on severity, with high-priority events triggering rapid review and lower-priority patterns accumulating for trend analysis. The system correlates data across sources so that, for example, a flagged refund transaction is automatically linked to the corresponding video footage for quick verification.
What roles exist within loss prevention?
Core roles include store-level LP associates who conduct initial investigations and monitor footage, district or regional LP managers who oversee shrinkage and safety outcomes across a portfolio of stores, specialized investigators who handle complex fraud and ORC cases, and regional directors who set strategy across multiple districts. Many organizations also rely on third-party remote monitoring services and consulting firms for specialized support.
What are the costs associated with loss prevention services?
Costs vary significantly based on the operating model. Technology-driven approaches involve hardware and installation, monthly cloud storage and processing fees, and annual software licensing. Organizations that blend centralized remote monitoring with targeted on-site personnel typically achieve the strongest balance of coverage and cost efficiency. Loss prevention investments consistently deliver strong returns through shrinkage reduction, though results depend on baseline shrinkage rates, merchandise categories, and regional factors.
About the author
Sud Bhatija is COO and Co-founder at Spot AI, where he scales operations and GTM strategy to deliver video AI that helps operations, safety, and security teams boost productivity and reduce incidents across industries.


.png)
.png)
.png)
.svg)