


Retail shrinkage cost U.S. retailers $112.1 billion in 2025—an $18 billion jump from the prior year (Source: Pygmalios). That figure represents more than theft. It includes vendor fraud, administrative errors, operational waste, and organized crime rings that exploit gaps across multi-location networks. For leaders responsible for protecting margins across dozens or hundreds of stores, shrink is the single largest controllable drag on profitability.
Yet most retailers still treat shrinkage as a line item to absorb rather than a KPI to drive down store by store. The median U.S. retailer loses roughly $1.40 for every $100 in sales—and that number climbs sharply in high-risk categories like cosmetics, electronics, and apparel (Source: Pygmalios). The gap between recording losses and stopping them is where margin recovery happens.
This article breaks down what shrinkage in retail actually means, clarifies each loss category, and maps the operational and technology levers that turn shrink from an accepted cost into a KPI you can actively drive down.
Key terms to know
Two terms recur throughout loss prevention conversations and are worth clarifying upfront.
Term | Definition |
|---|---|
Shrinkage (shrink) | The difference between recorded inventory in a retailer's system and the actual physical inventory on hand. The gap represents merchandise lost to theft, errors, damage, or fraud between supplier shipment and point of sale (Source: Extensiv). |
Shrinkflation | A pricing strategy where product size decreases while the price stays the same. Unlike shrinkage, shrinkflation does not reduce inventory counts—it affects consumer perception and purchase behavior (Source: Appriss Retail). |
The distinction matters operationally. Shrinkage directly erodes both top-line inventory value and gross margin. Shrinkflation is a merchandising decision. Conflating the two leads to misallocated resources.
One additional concept that matters for budgeting: shrink reserve refers to the financial allowance retailers set aside to account for expected inventory losses. It appears as a contra-revenue or expense line in retail accounting. Retailers who treat the reserve as a ceiling rather than a target tend to under-invest in the controls that would reduce actual losses below that threshold.
How much shrink actually costs per store
At enterprise scale, shrinkage compounds fast. A 1.4% shrink rate across a 500-store network operating with $2 billion in annual inventory translates to $28 million in annual loss. For specialty retailers in high-shrink categories, the math is worse: a $500 million revenue retailer running at 3.0% shrinkage loses $15 million. Moving that rate to 2.5% recovers $2.5 million in annual profit (Source: Pygmalios).
The impact goes beyond missing product. Unprocessed shrinkage corrupts inventory records, and the average U.S. retailer operates at just 65% inventory accuracy (Source: Linnworks). That level of inaccuracy cascades into stockouts, excess safety stock carrying costs averaging 20–30% annually, demand forecasting errors, and customer loyalty erosion.
Impact area | How shrink creates the problem |
|---|---|
Cash flow | Retailers absorb losses while funding replacement inventory through additional purchasing cycles. |
Fulfillment accuracy | Phantom inventory (items in the system but physically missing) causes failed orders and marketplace penalties. |
Safety stock costs | Low confidence in records forces buyers to pad orders, inflating carrying costs by 20–30% (Source: Linnworks). |
Customer experience | Out-of-stock conditions driven by inaccurate records erode loyalty and repeat purchase rates. |
The categories of shrinkage in retail
The 2026 Appriss Retail Total Retail Loss Benchmark Report breaks shrinkage into distinct sources. Understanding the composition—not just the total—is essential for directing resources where they matter most.
Shrinkage category | Annual loss | Share of total | Key characteristics |
|---|---|---|---|
Employee theft (internal shrink) | $26 billion | 29% | POS manipulation, unauthorized refunds, void transactions, collusion schemes (Source: Appriss Retail) |
Administrative and inventory errors | $19 billion | 21% | Mispicks, receiving errors, barcode mismatches, unprocessed damage write-offs |
Operational inefficiencies | $12 billion | 13% | Spoilage, damaged merchandise, coupon abuse, price manipulation |
Organized retail crime (ORC) | $9 billion | 10% | Coordinated, multi-location theft with resale through online marketplaces |
Returns-related loss | ~$18 billion | 20% | Wardrobing, bracketing, receipt fraud, cross-channel abuse |
Unknown / unclassified | ~$6 billion | 7% | Losses requiring deeper forensic analysis |
Several patterns stand out. Employee theft accounts for nearly a third of all shrinkage, and most of it occurs through POS manipulation—not direct merchandise removal. That makes it invisible to traditional camera systems and requires transaction-level analysis to detect (Source: ISS). Administrative errors accumulate silently; a single mispick cascades through inventory systems, causing false availability and multiple downstream failures before anyone notices (Source: Linnworks).
External theft incidents have risen 26% year-over-year (Source: Pygmalios). ORC groups specifically target high-velocity SKUs, test response times across locations, and exploit policy inconsistencies between stores.
Why self-checkout amplifies the problem
Self-checkout deserves its own discussion. Shrinkage at self-checkout lanes runs 3.5% compared to 0.2% at staffed lanes—a 17.5x difference (Source: Pygmalios). Despite this, 96% of retailers are either already using or planning to use self-checkout (Source: Blue Star). Eliminating it isn't viable. Hardening it is.
The primary loss behaviors at self-checkout break down as follows:
Behavior | Prevalence | Description |
|---|---|---|
Item hiding | 71% | Items placed behind or under other products to avoid scanning |
Barcode switching | 52% | Expensive item barcodes swapped for cheaper alternatives |
Item pass-around | 49% | Expensive items passed to companions while cheaper items are scanned |
Unintentional errors | 49% | Honest scanning mistakes by customers |
Effective self-checkout loss reduction requires layered controls: overhead and side cameras for full lane coverage, AI-powered detection for missed scans and item hiding, rule-based attendant prompts, and POS exception reporting tied to video clips. No single technology addresses the full range of behaviors.
What a good shrink percentage looks like
How do you know if your shrink rate is acceptable? The answer depends heavily on category mix and retail format.
Category | Typical shrink range |
|---|---|
Cosmetics | 3.0–3.5% |
Small electronics | 2.5–3.0% |
Apparel | 2.0–2.5% |
Household basics | 0.3–0.8% |
Grocery staples | 0.2–0.5% |
The industry median of 1.4% masks significant variation. A retailer operating primarily in high-shrink categories should benchmark against category-specific rates, not the blended median. Realistic improvement targets for a sustained enterprise program look like this:
Year 1: 0.3–0.5 percentage point reduction from baseline (e.g., 1.5% → 1.0–1.2%)
Year 2: Additional 0.2–0.3 point reduction (to 0.8–1.0%)
Year 3: Additional 0.1–0.2 point reduction, stabilizing at 0.6–0.8%
Early gains typically come from high-impact, lower-cost measures: POS exception reporting, staff training, and improved receiving procedures. Later gains require technology investment and process refinement.
How enterprise retailers reduce shrink across districts
Addressing shrinkage at scale requires a layered approach that combines foundational process discipline with technology that makes every loss category visible.
Foundational controls that must come first
Technology amplifies existing operations. If receiving procedures are broken, cycle counting is inconsistent, or POS controls are weak, deploying advanced analytics will surface the mess but not solve it (Source: ISS). Three foundational controls form the baseline:
Cycle counting over annual audits. Continuous counting of rotating inventory subsets catches discrepancies while they're still traceable. ABC methodology segments items by value and velocity—high-value items counted daily, medium items monthly, low-value items quarterly (Source: Extensiv).
Separation of duties and role-based POS access. Employees who initiate refunds should not authorize them. Audit trails capturing timestamp, employee ID, transaction type, and amount create accountability without requiring constant human oversight (Source: ISS).
Receiving dock discipline. Blind receiving (without prior knowledge of PO quantities) forces count verification. Dual verification for high-value shipments and restricted backroom access reduce receiving fraud.
Exception-based reporting for internal shrink
POS exception reporting shifts investigation from "find something suspicious" to "the system flags high-risk events, investigators review video for confirmation." High-risk transactions flagged automatically include clustered voids, high-value refunds without receipts, no-sale drawer openings, and repeated price overrides (Source: ISS).
Multi-store comparison reveals patterns that single-store investigation would miss. If five locations report unusual refund clusters on the same employee's shifts, coordinated fraud becomes evident. Walmart's implementation of predictive analytics for employee theft detection, combined with training programs, achieved a 0.05% reduction in shrink rate—translating to $167 million in annual savings (Source: Pygmalios).
Video AI that acts on multiple shrink categories
Traditional cameras only record what already happened. They capture footage that someone reviews after a loss has already occurred. Across enterprise retail, teams are moving toward video that plugs into LP workflows so cameras can trigger action in the moment—not just feed reports.
How does this work in practice? When a POS exception occurs—a refund without receipt, a high-value void, an unusual discount—the system automatically retrieves relevant video footage and presents it to investigators with context. A loss prevention team that would manually review footage for 20 hours on a single suspicious transaction can instead triage 100 flagged exceptions in similar time through AI-assisted review (Source: My Total Retail).
Spot AI's unified video AI platform connects to existing cameras—no rip-and-replace required—and layers AI Agents on top that detect, flag, and act on key loss drivers:
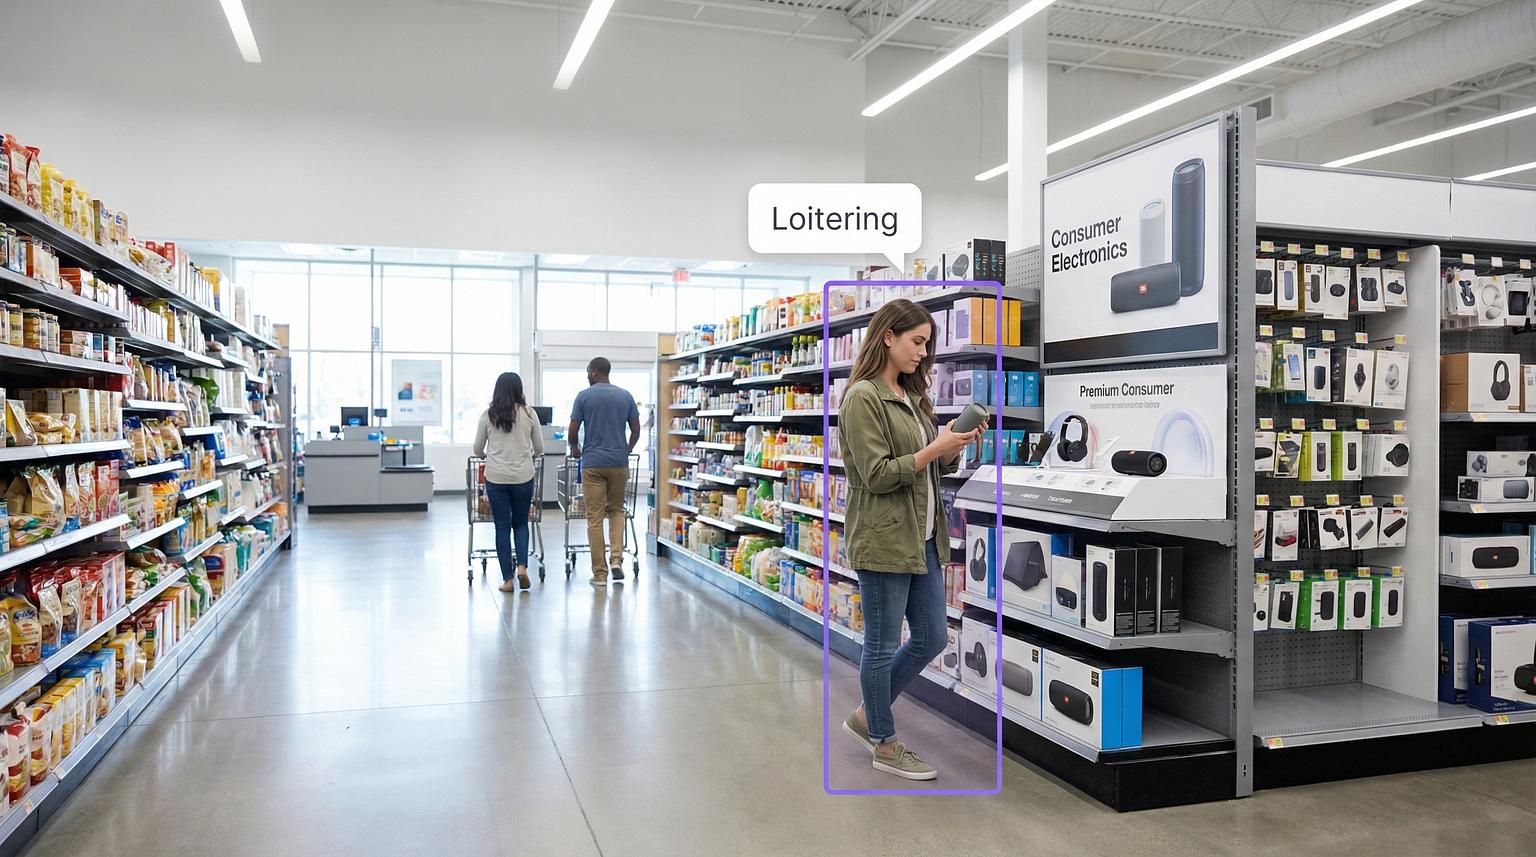
External theft and ORC: Loitering detection, unauthorized entry alerts, and license plate tracking identify repeat offenders and coordinated theft patterns across locations.
Internal theft: POS integration links transactions directly to time-stamped video. No-sale drawer opens, excessive refunds, and void patterns are automatically bookmarked for review.
Administrative errors: Video verification at receiving docks helps confirm delivery counts against records, catching discrepancies at the point of origin.
Operational loss: Unattended checkout and queue management alerts help ensure staffing matches traffic, reducing both customer friction and the conditions that enable opportunistic theft.
For multi-location networks, Spot AI's cloud dashboard gives district teams a consistent view of incident trends, alert volumes, and shrink-correlated activity—so ROI is easier to defend in budget reviews.
Real results: All Star Elite's shrink reduction
All Star Elite, a multi-location sports apparel retailer with 80 U.S. stores, deployed Spot AI's platform to address shrink across its network. The results were measurable and specific:
Cash shrink dropped from approximately 6% to 1%—an 83% reduction.
Merchandise shrink decreased from 10–15% to approximately 6% with improved video coverage and investigation workflows.
Investigation efficiency improved by over 50%, cutting incident resolution from hours to minutes using centralized case management and AI-powered search.
Law enforcement case timelines improved from 2–3 months to roughly 1 month due to faster evidence collection and sharing.
Store operations insights (people counting, traffic-flow analysis) supported sales lifts of 5–15% through product placement changes and informed the closure of three underperforming stores.
Read the full All Star Elite case study for details on their deployment approach.
Limitations and considerations for any shrink reduction program
No tool or process drives shrink to zero. Several factors deserve honest consideration:
Baseline measurement must come first. Without accurate current shrink rates by location, category, and source, improvement cannot be measured. Retailers operating below 90% inventory accuracy should prioritize accuracy improvements before deploying loss prevention technology (Source: ISS).
Technology without process discipline falls short. Deploying video analytics on top of broken POS controls or inconsistent receiving produces visibility into problems without solving them.
Change management is non-negotiable. Store teams must understand not just what to do, but why it matters. Recognition programs for accurate inventory management and compliance reinforce positive behavior—loss prevention should not be purely accountability-driven.
AI detection supports human decision-making. While AI can flag patterns and surface likely events, human judgment should review final decisions, particularly for high-consequence outcomes like employee termination or customer restrictions.
Not all locations face equal risk. Effective programs tier stores based on historical incidents, high-value SKU concentration, and geographic factors. Resources should be deployed strategically, not spread evenly.
From recording losses to engineering outcomes
Shrinkage is not a fixed cost of doing business. The retailers achieving sub-1% shrink rates are the ones treating it as a performance indicator subject to the same rigor as sales growth or margin expansion. They measure it by category and location, address root causes across loss types, and deploy technology that acts on events as they happen—not after the loss is already booked.
The shift from reactive recording to active deterrence and detection is where the margin recovery lives. Whether that means tightening POS controls, hardening self-checkout, or extending coverage to parking lots and perimeters, the common thread is visibility paired with action.
"In our old approach, we were always reactionary. We'd review footage after an incident occurred, but we needed to move beyond that. With facilities spread across 800 acres, it's impossible for our team to see everything happening in real-time."
Mike Tiller, Director of Technology, Staccato (Source: Spot AI)
If you're building the case for enterprise-wide shrink reduction, or scaling a pilot that's already working, schedule a Spot AI demo to see how AI Agents connect to your existing cameras, flag high-risk events, and speed up review across every location.
Frequently asked questions
What are the main causes of shrinkage in retail?
Retail shrinkage stems from four primary sources: employee theft (29% of total shrinkage, or $26 billion), administrative and inventory errors (21%, or $19 billion), operational inefficiencies like spoilage and damage (13%, or $12 billion), and organized retail crime (10%, or $9 billion). Returns-related losses account for an additional 20%. Most employee theft occurs through POS manipulation rather than direct merchandise removal, making transaction-level analytics essential for detection.
How can retailers effectively reduce shrinkage?
Effective shrink reduction starts with foundational process controls—cycle counting, separation of duties at POS, and receiving dock discipline—before layering technology on top. POS exception-based reporting flags high-risk transactions for investigation. Video AI platforms link those flagged transactions directly to time-stamped footage, reducing investigation time from hours to minutes. Enterprise programs also require centralized monitoring across locations to identify cross-store patterns that single-store investigation would miss.
What is an acceptable shrinkage rate in retail?
The U.S. retail median sits at 1.4% of sales, but acceptable rates vary widely by category. Cosmetics typically run 3.0–3.5%, apparel 2.0–2.5%, and grocery staples 0.2–0.5%. A realistic enterprise improvement target is a 0.3–0.5 percentage point reduction in year one, with additional gains of 0.2–0.3 points in year two. Retailers should benchmark against category-specific rates rather than the blended industry median.
What technologies help reduce retail shrinkage?
The most impactful technologies for shrink reduction include POS exception-based reporting (flagging unusual transactions automatically), video AI platforms that link transactions to footage and detect behaviors like loitering or unauthorized entry, and RFID for item-level inventory tracking. Video analytics platforms can reduce investigation time by 50% or more by directing teams to relevant footage through AI-generated alerts rather than manual review.
How does employee theft contribute to overall shrinkage?
Employee theft accounts for $26 billion annually—29% of all retail shrinkage. The majority of employee theft occurs through POS manipulation: unauthorized refunds, void transactions, collusion schemes, and no-sale drawer opens. Detection typically requires transaction-level exception reporting combined with video verification, because these behaviors are often invisible to standard camera coverage alone.
About the author
Sud Bhatija is COO and Co-founder at Spot AI, where he scales operations and GTM strategy to deliver video AI that helps operations, safety, and security teams boost productivity and reduce incidents across industries.


.png)
.png)
.png)
.svg)