






The 8 wastes of lean manufacturing: how to detect and eliminate them with video AI in 2026
Every manufacturing floor hides waste that never shows up on a Gemba walk. It sits between shifts, in the minutes lost to a slow changeover, in the extra steps an operator takes, and in the runs no supervisor happened to watch. The cost is real: unplanned downtime alone costs industrial manufacturers an estimated $50 billion a year (Source: Deloitte), and downtime can consume 8.3 to 13.3 percent of planned production time in US manufacturing (Source: NIST). Video AI turns the cameras a plant already owns into a continuous set of eyes that detect and document the eight wastes of lean manufacturing, on every shift and every line.
Key takeaways
- The eight wastes of lean, captured by the acronym DOWNTIME, are defects, overproduction, waiting, non-utilized talent, transportation, inventory, motion, and excess processing.
- Traditional waste hunting relies on Gemba walks and manual audits that sample only a slice of activity, so most waste stays invisible between observations.
- Video AI benchmarks how work actually runs against a gold-standard shift, quantifies each waste with timestamped evidence, and surfaces drift while the shift is still on the clock.
- The strongest programs tie waste reduction to outcome KPIs leadership already tracks, such as OEE, cycle time, and changeover time, rather than counting waste in isolation.
- Spot AI works with the cameras a plant already owns, so operations teams gain cross-shift, cross-site visibility without a rip-and-replace project.
What are the 8 wastes of lean manufacturing?
Lean thinking defines waste as any activity that consumes resources without adding value from the customer's point of view. The eight wastes are most easily remembered by the acronym DOWNTIME, which continuous improvement teams use as a checklist when they walk a line:
- Defects: products that need rework or scrap.
- Overproduction: making more than demand requires.
- Waiting: idle time between process steps.
- Non-utilized talent: underusing the skills and knowledge of people.
- Transportation: unnecessary movement of materials.
- Inventory: excess raw materials, work in progress, or finished goods.
- Motion: unnecessary movement of people or equipment.
- Excess processing: doing more work than the customer values.
The challenge has never been naming the wastes. It is seeing them. Most of the eight play out continuously, across every shift and every corner of a plant, while the people responsible for finding them can only be in one place at a time.
Key terms
- DOWNTIME: the acronym for the eight lean wastes (defects, overproduction, waiting, non-utilized talent, transportation, inventory, motion, excess processing).
- Gemba walk: going to the actual place where work happens to observe a process firsthand.
- OEE: overall equipment effectiveness, a combined measure of availability, performance, and quality.
- Takt time: the pace at which a product must be completed to meet customer demand.
Why traditional waste identification falls short
Continuous improvement professionals spend much of their week firefighting: reacting to a defect, a stoppage, or a safety event after it has already cost something. Manual Gemba walks capture only snapshots, and they miss the events that happen between observations. A changeover that ran long at 2 a.m., a forklift that took the long route, an operator who kept walking back for a tool, none of it survives unless someone was watching at that moment.
Verifying SOP adherence across every shift and site is harder still. Without continuous monitoring, consistency depends on whoever is on the floor, which lets process variation hide until it shows up as scrap or a missed changeover window. Root cause analysis then takes weeks, because reconstructing what happened means sifting through hours of footage by hand.
The stakes are rising as the workforce tightens. US manufacturing may need 3.8 million new workers between 2024 and 2033, with roughly 1.9 million roles at risk of going unfilled if the skills and applicant gap is not closed (Source: Deloitte and The Manufacturing Institute). Sixty percent of manufacturers now rank the skills shortage as having a high or very high impact on productivity over the next three years (Source: Deloitte). With fewer experienced people to watch the floor, the plants that pull ahead are the ones that give every shift the same objective view of a good run.
How video AI detects the 8 wastes
Video AI has moved well beyond legacy motion detection. Modern models watch live feeds from the cameras a plant already owns, reason about what they see, and benchmark each run against a taught standard. Rather than replacing the continuous improvement team, they give it continuous coverage, so the eight wastes become visible with timestamped evidence instead of anecdotes. The table below maps each lean waste to how it shows up on the floor and how a video AI system surfaces it.
Lean waste | How it shows up on the floor | How video AI detects it |
|---|---|---|
Defects | Rework and scrap that trace back to a missed step or a wrong setup. | Flags deviation from the standard sequence and preserves the clip for root cause review. |
Overproduction | Runs that continue past demand, building work in progress. | Counts output against pull signals and surfaces accumulation at a station. |
Waiting | Product sitting idle between steps, or a line stopped and waiting on a fix. | Measures queue and idle time at each station and alerts on stoppages in real time. |
Non-utilized talent | Know-how locked in a few veterans and improvement ideas that never surface. | Turns the best shift into a shareable gold-standard run any operator can learn from. |
Transportation | Materials moved farther or more often than needed. | Tracks forklift routes, handling frequency, and distance traveled per move. |
Inventory | Work in progress piling up between operations. | Monitors buffer levels and highlights where inventory grows against takt. |
Motion | Operators walking for tools, parts, or information. | Runs time and motion studies at scale, quantifying steps and reach patterns per shift. |
Excess processing | Extra steps or checks that add no value the customer sees. | Compares actual steps to the standard and surfaces repeated, non-value tasks. |
Start with the one or two wastes that hurt most on a single high-frequency process, such as waiting and motion on a changeover. A narrow, measurable first use case turns the DOWNTIME checklist into timestamped evidence faster than trying to watch the whole plant at once.
Eliminating waiting, motion, and transportation waste on the floor
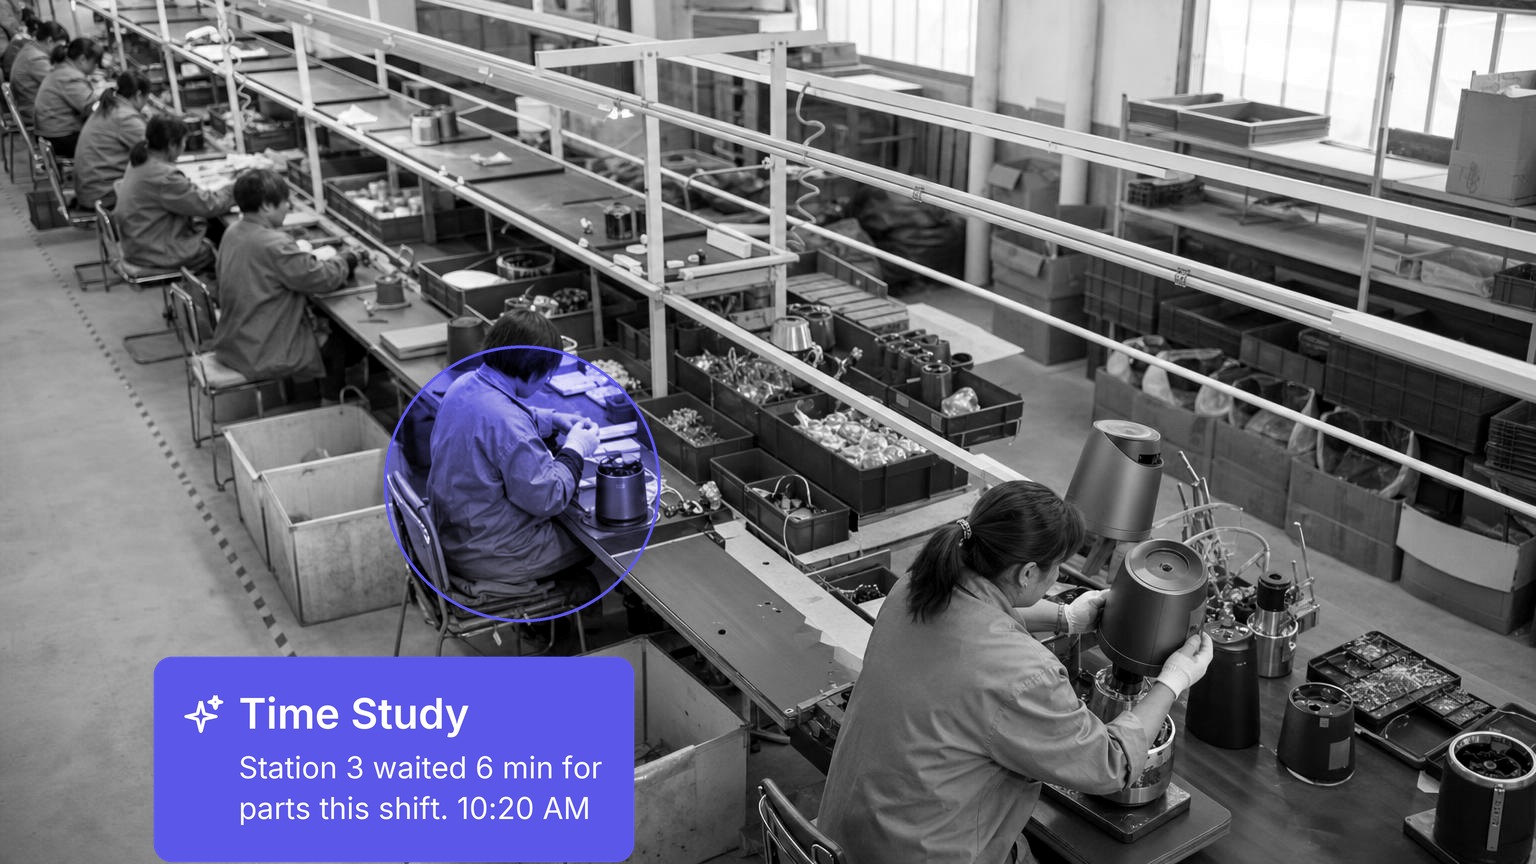
Waiting, motion, and transportation are the three wastes that hide most easily and add up most quickly, because they show up as a few lost seconds repeated hundreds of times a shift. Time and motion studies that were once impossible to run at scale become continuous. A video AI system captures and quantifies:
- Queue and idle time between workstations.
- Operator movement patterns and distance traveled.
- Material handling frequency and forklift routing.
- Equipment utilization and bottleneck formation through crowding detection.
- Cross-docking and staging efficiency.
When an operator consistently walks across the floor to retrieve a tool, the system documents that motion with timestamps and frequency. That evidence turns a vague hunch into a targeted fix, such as relocating the tool or redesigning the workstation to cut steps per shift. The same footage shows materials being moved multiple times before reaching their destination, the classic transportation waste that a periodic walk would never catch. Because the data comes from the cameras a plant already runs, teams gain this real-time visibility without new hardware to install.
Turning non-utilized talent and excess processing into gains
The eighth waste, non-utilized talent, is often the largest missed opportunity in a plant, and it is the hardest to see with a clipboard. When know-how lives only in a few veterans' heads, it leaves when they retire, and improvement ideas from the floor rarely make it up the chain. Video AI democratizes this: when the system flags a process variation, it produces a clip any operator or supervisor can use to propose a change, so improvement becomes an organization-wide habit rather than a specialist function.
Excess processing responds to the same objective lens. By comparing actual runs to the standard, the system surfaces steps that add no value the customer sees, from overly tight tolerances to a check performed twice. The payoff is visible in the numbers: manufacturers reported on average a 10 to 20 percent improvement in production output, a 7 to 20 percent improvement in employee productivity, and 10 to 15 percent unlocked capacity from smart-manufacturing implementations (Source: Deloitte). When many people each contribute a small, shared improvement, the cumulative savings compound. You can see how manufacturers extend the same cameras well beyond security in this look at video footage for operations.
Real-time monitoring for rapid waste elimination
The shift from periodic review to continuous monitoring is what makes waste elimination fast. Instead of discovering a problem during a monthly audit, teams receive an alert when waste occurs, while there is still time to act on the same shift. A video AI platform gives live visibility into machine performance, work-in-progress accumulation, labor efficiency, quality deviations before they become defects, and safety compliance, all on one dashboard drawn from existing cameras.
That immediacy changes the culture. Managers can reassign an underused machine, clear a bottleneck, or coach an operator in the moment rather than reconstructing the event days later. The direction of the industry rewards it: AI-driven Global Lighthouse Network sites report on average a 40 percent increase in labor productivity and a 48 percent reduction in lead times, with some sites cutting waste by up to 70 percent (Source: McKinsey).
Measuring success: the KPIs that matter
Waste reduction is a means, not an end. The most useful programs connect it to outcome metrics leadership already tracks, then review the trend by shift and site. Video AI supplies the continuous, objective measurement these KPIs used to lack, so the number on the board reflects what actually happened on the floor rather than a monthly sample. The table below shows the four that matter most for lean waste and how video AI moves each one.
KPI | What it measures | How video AI moves it |
|---|---|---|
OEE | Availability, performance, and quality combined. | Cuts unplanned stoppages and process variation that drag all three factors down. |
Cycle time | Time to complete one unit through a process step. | Times each visible unit continuously and pinpoints the step where waiting or motion creeps in. |
Changeover time | Minutes lost switching a line between products. | Benchmarks every changeover against the best run and flags where the sequence drifts. |
First pass yield | Share of output that passes without rework. | Rises as every shift follows the same validated steps, reducing defects at the source. |
Pair every waste you target with one outcome KPI before you start measuring. Tying waiting and motion to cycle time, or changeover drift to OEE, keeps the focus on results and makes the business case obvious to leadership.
Changeover: where lean waste reduction pays off fastest
Changeovers concentrate several wastes at once, waiting, motion, and excess processing, which is why they are often the fastest place to prove value. The discipline of SMED, single-minute exchange of die, only holds if every shift runs the same sequence, and that is exactly what continuous monitoring supports. An AI Operations Assistant watches each changeover, benchmarks it against the best run, and delivers a scorecard with the specific steps that drifted, so teams adjust on the next cycle rather than the next quarter.
The financial upside is significant when the standard holds across sites. One Fortune 500 packaging leader used an AI Operations Assistant to review changeovers on high-volume lines and cut the average from 28 to 21 minutes over six months, a 25 percent gain worth an incremental $15 million in throughput per plant per year at zero new capital spend.
We've added an incremental $15M a plant in throughput. Across 19 NA sites, it's like adding a whole extra plant, at zero capex.
VP Operations, Fortune 500 packaging leader
A separate $12 billion manufacturer saw a 15 percent reduction in changeover time within the first three weeks, with an AI Operations Assistant evaluating every run, generating report cards with action items, and flagging where a run drifts from the standard. These are customer-reported outcomes, not guarantees, but they point the same way: steadier changeovers lift availability, a consistent sequence protects performance, and fewer misreads support quality, so the whole OEE picture improves at once.
How Spot AI eliminates lean waste across shifts
Spot AI turns the cameras a plant already owns into an AI Operations Assistant that watches every run, benchmarks it against a gold-standard shift, and delivers scorecards with focused coaching. Because the platform is camera-agnostic and works with any IP camera, teams gain cross-shift, cross-site visibility without a rip-and-replace project, and most sites go live in days rather than months.
The operating model is straightforward: teach the system a good process with video, images, and the written SOP; let it watch and evaluate each run against that standard; then act on the scorecards and recommendations it produces. Operators get specific feedback to improve faster, supervisors see where a shift drifts, and leadership gets cross-site trends to compare plants and reward the best performers. Full-resolution video stays in the facility on an edge-first Intelligent Video Recorder, so only metadata crosses the network, and the platform is NDAA-compliant and SOC 2. It does not use biometric identification.
Open APIs and webhooks let waste and adherence data flow into the MES, ERP, and reporting tools a plant already runs, so monitoring adds to the operating picture instead of becoming another siloed tool to check. To go deeper on a specific waste, see how video AI helps teams detect manufacturing inefficiencies, review real outcomes in our customer stories, or explore the wider gains in business productivity.
Ready to turn your cameras into a continuous waste-detection system for every shift? Book a demo to see how Spot AI supports lean waste reduction across your operation.
Frequently asked questions
What are the 8 wastes of lean manufacturing?
The eight wastes are captured by the acronym DOWNTIME: defects, overproduction, waiting, non-utilized talent, transportation, inventory, motion, and excess processing. Each one consumes resources without adding value the customer sees. Video AI helps identify them by continuously monitoring production, tracking material and operator movement, and comparing runs to a standard.
How does video AI detect manufacturing waste?
Video AI watches live feeds from a plant's existing cameras, benchmarks each run against a taught gold-standard run, and flags where timing, sequence, or movement drifts. It quantifies waiting, motion, and transportation with timestamped evidence and routes a scorecard to the right supervisor. This turns waste from an anecdote noticed on a walk into objective data any team can act on.
Which lean waste should a plant tackle first with video AI?
Start with the one or two wastes that hurt most on a single high-frequency process, often waiting and motion on a changeover. A narrow, measurable first use case shows value faster than trying to monitor an entire plant at once. Once the approach proves out, teams extend it to the other wastes and additional lines.
Does video AI for lean manufacturing require new cameras?
No. Spot AI is software-led and camera-agnostic, so it works with the IP cameras a plant already owns and connects legacy analog gear through the Intelligent Video Recorder. That means teams gain cross-shift visibility without a rip-and-replace project, and most sites go live in days.
How do you measure the impact of reducing lean waste?
Pair each waste you target with an outcome KPI leadership already tracks, such as OEE, cycle time, changeover time, or first pass yield. Baseline current performance, tie each waste to a measurable result, and review the trend by shift and site. Continuous monitoring supplies the objective data these metrics need instead of relying on a periodic manual sample.
About the author
Sud Bhatija is COO and Co-founder at Spot AI, where he scales operations and GTM strategy to deliver video AI that helps operations, safety, and security teams boost productivity and reduce incidents across industries.

