


How to build a loss prevention dashboard that turns cameras into AI teammates
Retail shrink is no longer just a theft problem. It is a data integrity crisis that distorts inventory accuracy, replenishment signals, and financial reporting across every channel. (Source: Retail-insider) A 2026 study by the ECR Retail Loss Group found that stores with self-checkout generate between 33% and 147% higher losses than comparable stores without it, proving that new customer-facing technologies can quietly compound shrink if left unmonitored. (Source: Ecrloss) For VPs of loss prevention, the answer is not more cameras or more headcount. It is an executive loss prevention dashboard that unifies POS exceptions, inventory variances, and video AI detections into a single command center for action, proof, and accountability across every store.
🎯
Key takeaways
- A loss prevention dashboard should consolidate five to 15 outcome-based KPIs, including shrink percentage, refund and void rates, cash variance, investigation time, and self-checkout exception density.
- Every additional 1% of transactions routed through self-checkout correlates with an estimated 0.030% to 0.048% increase in shrink, making SCO mix a critical dashboard tile. (Source: Ecrloss)
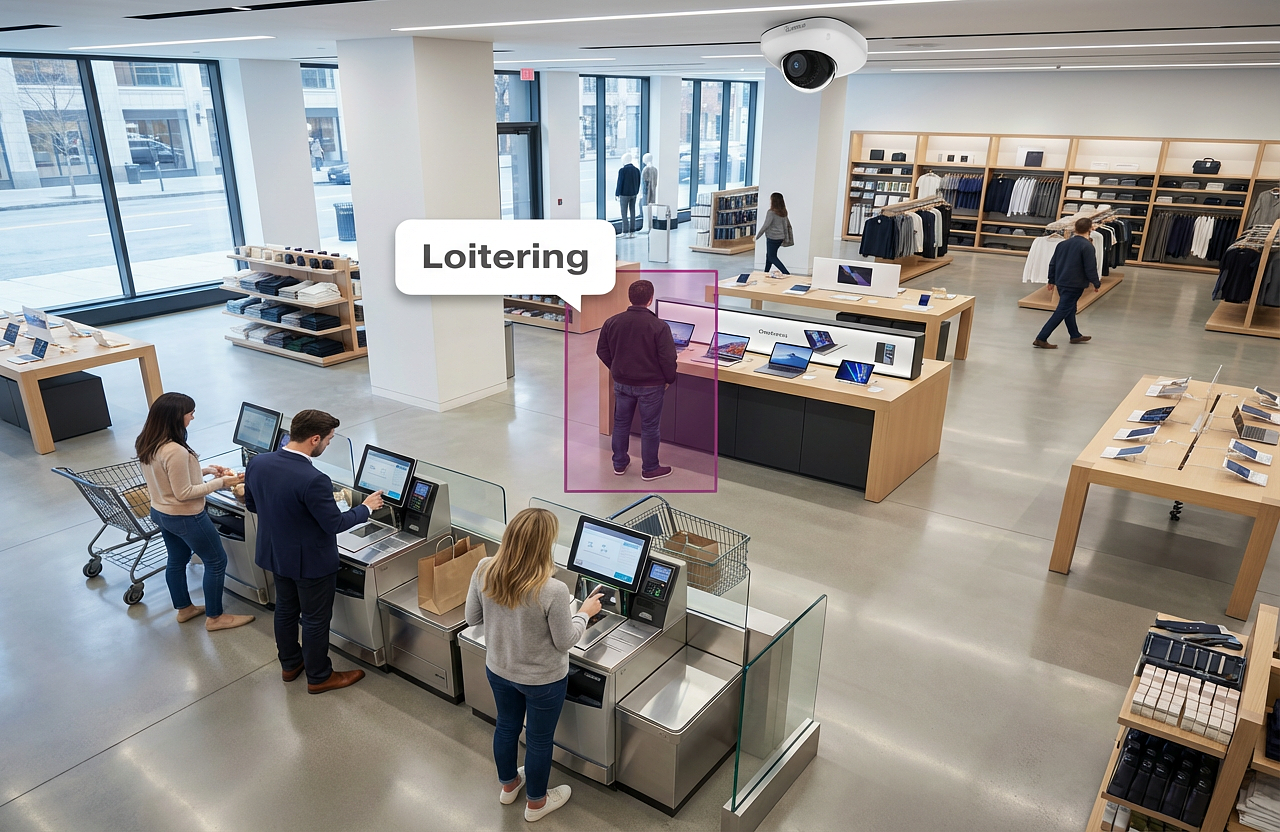
- Video AI Agents transform cameras from passive recorders into AI teammates that surface POS-linked anomalies, loitering, and unauthorized access in real time.
- Open API architectures connect POS, inventory, and video data so LP teams can correlate a flagged refund with timestamped video evidence in seconds, not hours.
- Role-based dashboard views (executive, regional, store) ensure every leader sees the metrics they need to act, from portfolio-level shrink trends to daily cash handling scores.
📖
Key terms
- Loss prevention dashboard: a visual interface that consolidates KPIs from POS, inventory, and video systems to give LP leaders a real-time view of risk, compliance, and operational health across locations.
- Exception-based reporting (EBR): the practice of flagging unusual transaction patterns, such as high refund rates, frequent voids, or price overrides, that often signal fraud or process gaps.
- Video AI Agents: intelligent software that analyzes camera feeds to detect context-aware behaviors like loitering, unauthorized zone entry, or unattended checkouts, and then alerts teams to act.
- Shrink (shrinkage): the gap between recorded inventory and actual inventory, driven by external theft, internal theft, administrative errors, vendor fraud, and increasingly, technology-design risk at self-checkout.
Why traditional LP reporting falls short in 2026
Most loss prevention teams still rely on a patchwork of spreadsheets, siloed POS exception reports, and hours of manual video scrubbing. That approach made sense when shrink was primarily a shoplifting problem. Today, the landscape is different. Returns alone represent a double-digit percentage of total U.S. retail sales, and a significant share involves fraud or policy abuse. (Source: Capitaloneshopping) Self-checkout adds another layer: ECR data shows that missed scans are the most common SCO loss type, and disabling weight controls at one retailer led to a 20% shrink increase. (Source: Ecrloss)
Meanwhile, McKinsey estimates that an end-to-end AI transformation across Europe's retail sector could unlock between €240 billion and €320 billion in economic value over five years, reinforcing the case for treating loss prevention analytics as part of a broader AI-enabled performance agenda. (Source: McKinsey) The implication for LP leaders is clear: a retail loss prevention dashboard is no longer a nice-to-have reporting layer. It is the operating system for shrink reduction, investigation speed, and executive-ready accountability.
The core frustrations a loss prevention dashboard solves
Cameras that record but never reason
In a traditional setup, cameras capture footage that sits on a hard drive until someone manually searches it after a loss event. Nearly all of that footage goes unreviewed. An executive loss prevention dashboard changes the equation by connecting cameras to video AI analytics that surface the moments that matter: a high-value void at register three, a person lingering in a restricted zone, or an unattended checkout lane during peak hours. Instead of reviewing footage after the loss, LP teams receive context-aware detections while the event unfolds.
Siloed systems that hide the full picture
POS data lives in one platform. Inventory counts live in another. Video sits on a local recorder with no connection to either. This fragmentation forces analysts to toggle between tools, manually correlate timestamps, and piece together narratives for every investigation. An open API architecture solves this by connecting transaction data, inventory signals, and video evidence into a single dashboard view. When a refund anomaly triggers an alert, the associated video clip is already linked, cutting investigation time from hours to minutes.
Proving ROI to the C-suite
LP directors frequently struggle to demonstrate the financial return of security investments. Without clear metrics, the function gets treated as a cost center. A well-designed loss prevention ROI dashboard quantifies mitigated incidents, tracks shrink reduction over time, and benchmarks investigation efficiency across regions. That data transforms the conversation from "we need more budget" to "here is the measurable value we delivered this quarter."
💡
Retailers who have scaled AI across multiple decision areas, supported by clear and manager-friendly interfaces, have seen EBITDA uplifts in the mid-teens percentage range. Treating your loss prevention dashboard as part of a broader AI-enabled performance agenda — not a standalone security tool — is key to unlocking that value. (Source: McKinsey)
Essential KPIs for a loss prevention dashboard
An effective shrink dashboard balances lagging indicators (what already happened) with leading signals (what is likely to happen next). Overloading the view creates noise. The strongest executive dashboards focus on five to 15 core loss prevention KPIs that drive accountability and action. The table below maps the most critical metric categories to their strategic value.
Metric category | Key performance indicator | Strategic value |
|---|---|---|
Shrinkage | Shrink % by store, category, and channel | Measures fundamental loss against sales. Enables cross-store benchmarking and resource allocation. |
Financial control | Cash variance, refund rate, void and override frequency | Surfaces cash handling errors and potential internal theft through POS integration. Returns alone represent a double-digit share of U.S. retail sales. (Source: Capitaloneshopping) |
Self-checkout risk | SCO utilization rate, SCO exception density, SCO loss per transaction | Every additional 1% of transactions through SCO correlates with a 0.030% to 0.048% shrink increase. (Source: Ecrloss) |
Operational accuracy | Inventory accuracy %, unexplained adjustment patterns | Provides early warnings of phantom inventory, data integrity gaps, and replenishment distortions. |
Investigation efficiency | Average case resolution time, cases closed per analyst per week | Tracks the operational impact of video AI and centralized search in reducing manual review. |
Compliance | Audit score, SOP adherence rate, governance indicator | Ensures consistent implementation of safety, security, and data-handling policies across locations. |
Data quality | Unexplained inventory variances, systemic adjustment frequency | Captures signals that traditional shrink metrics miss, treating loss as a data integrity problem. (Source: Retail-insider) |
NRF's guidance on operating in a world of constant disruption stresses the importance of forward-looking metrics. Loss prevention dashboards should balance traditional lagging indicators like shrink percentage with anticipatory KPIs such as forecasted loss exposure by region, channel, or technology. (Source: National Retail Federation)
Designing for clarity and rapid decision-making
A dashboard that takes more than five seconds to interpret will be ignored. Effective retail loss prevention dashboards follow a "five-second rule," where the viewer grasps overall status and identifies variances at a glance. Design choices matter as much as data selection.
Visual hierarchy principles
- Traffic-light logic: use consistent color coding (red for critical, yellow for warning, green for stable) so regional directors and store managers can scan status without reading every number.
- Progressive disclosure: present high-level summary metrics at the top, with the ability to drill into region, store, and transaction-level details on demand.
- Mobile responsiveness: regional directors traveling between sites need dashboards that load fast and surface essential data on a phone screen.
Role-based views for a multi-store loss prevention dashboard
Deloitte's research on AI-enabled operating models finds that organizations are increasingly mapping decision flows rather than hierarchies, which supports designing dashboards that surface the specific information each role needs to act. (Source: Deloitte) Three views cover most retail organizations:
- Executive view: five to seven high-level KPIs, year-to-date trends, and variance from budget. This is the loss prevention scorecard the C-suite reviews quarterly.
- Regional director view: store-level performance comparisons, outlier identification, and locations requiring timely intervention. Heat maps reveal geographic concentrations of shrink or organized retail crime activity.
- Store manager view: daily operational metrics, task management, cash handling scores, and specific action items. This view fosters accountability at the frontline without requiring managers to interpret enterprise-level data.
How video AI turns cameras into a loss prevention command center
Video technology has evolved from a passive recording tool into a rich, structured data source. By unifying video AI with executive dashboards, retailers correlate visual evidence with transactional and operational data in a single workflow.
Real-time, context-aware detections
Spot AI's AI Security Guard acts as an AI teammate that identifies specific behaviors preceding loss, not just motion. Key detections include:
- Loitering in high-risk zones: detecting individuals lingering near high-value merchandise or back-of-house areas without authorization.
- Unauthorized zone entry: alerting staff when untrained personnel or unauthorized individuals access restricted areas such as stockrooms or cash offices.
- Unattended checkout monitoring: flagging service areas where staff absence increases the risk of walkaways or scan-avoidance.
- After-hours intrusion: surfacing activity outside business hours with timestamped, case-ready video evidence.
These detections feed directly into the loss prevention incident dashboard, where each alert is linked to the associated camera feed, store location, and time. LP analysts no longer toggle between systems. They see the alert, review the clip, and resolve or escalate within a single interface.
Correlating video with POS exception reporting
Integrating video with POS data creates a powerful anomaly detection capability. When a dashboard flags a high-value refund, a voided transaction, or a pattern of price overrides, the system can surface the associated video clip automatically. This correlation helps distinguish between administrative errors, training gaps, and actual internal theft. ECR's research confirms that linking POS exceptions to observed behaviors, such as missed scans and walkaways at self-checkout, directly strengthens shrink outcomes. (Source: Ecrloss)
Accelerating investigations
One of the largest drains on LP resources is the time consumed by manual video review. A single case can take hours of scrubbing through footage. Dashboards integrated with an intelligent video platform allow teams to search for incidents by keyword, behavior type, or linked POS exception. That search capability compresses investigation timelines and frees analysts to focus on pattern analysis and prevention rather than manual review.
Architecture for enterprise loss prevention visibility
Managing security standards across dozens or hundreds of locations demands a centralized view that does not sacrifice local detail. The U.S. saw a net closure of nearly 2,000 brick-and-mortar retail establishments in 2024, highlighting how uneven performance and risk exposure can be across a fleet. (Source: Capitaloneshopping) A well-architected enterprise loss prevention dashboard addresses this unevenness at every level.
Centralized oversight with portfolio-level views
Corporate-level dashboards aggregate shrink metrics, investigation KPIs, and compliance scores across the entire chain. Heat maps reveal geographic concentrations of organized retail crime activity or emerging risk clusters. NRF emphasizes that retailers must build flexible, multi-node visibility that integrates store, distribution center, and e-commerce loss signals in a single architecture. (Source: National Retail Federation)
Store-level accountability and coaching
Dashboards empower local managers by giving them visibility into their own performance: cash handling accuracy, SOP adherence, audit scores, and incident resolution times. Stores achieving targets can be recognized, while underperforming locations receive targeted support and coaching. This approach treats the dashboard as a coaching tool, not a punitive report.
Open integration as the foundation
Spot AI's open API and webhook architecture connects cameras, POS systems, access controls, and inventory platforms into a unified data layer. A camera-agnostic approach means no rip-and-replace of existing hardware. Most sites go live in days, and the platform scales across locations without per-camera licensing friction. Open APIs, webhooks, and a live Model Context Protocol (MCP) endpoint let any authorized system query video data, run reports, and surface incident insights with read-only permissions.
✅
When building your integration architecture, prioritize these three factors for maximum impact:
- Choose a camera-agnostic platform with open APIs so POS, inventory, and access control data flow into a single dashboard without hardware lock-in.
- Ensure every alert links directly to timestamped video evidence, compressing investigation time from hours to minutes.
- Pair role-based dashboard views with role-specific training so that executives, regional directors, and store managers each act on the metrics most relevant to them.
Implementation roadmap for an executive LP dashboard
Deploying a loss prevention dashboard is as much an organizational change project as a technical one. Success depends on adoption, process integration, and clear ownership of metrics at every level. Deloitte argues that in AI-enabled operating models, middle management layers are reshaped with a stronger emphasis on data fluency and governance, which means dashboard rollouts should be paired with role-specific training. (Source: Deloitte)
- Define business objectives: clarify the specific outcomes desired, such as reducing shrink by a target percentage, cutting average investigation time, or improving audit compliance scores across a region.
- Audit existing data sources: map every POS system, inventory platform, video recorder, and access control system across locations. Identify integration gaps and data quality issues before selecting a dashboard platform.
- Pilot in a controlled environment: start with a small number of stores to refine alert thresholds, validate KPI definitions, and test escalation workflows. NRF's analysis of supply chain disruption underscores the importance of scenario planning and structured contingency plans as part of formal risk management programs. (Source: National Retail Federation)
- Establish data governance: standardize definitions for data entry across all locations so that metrics are comparable and reliable. Include data quality signals (unexplained variances, systemic adjustments) as first-class KPIs.
- Define escalation workflows: clarify who investigates flagged anomalies, the timeline for resolution, and how outcomes are documented. Only 9% of organizations patch critical vulnerabilities within 24 hours, a reminder that even well-designed controls fail without realistic workflows. (Source: Security Magazine)
- Scale and iterate: expand the dashboard to additional stores and regions, incorporating lessons from the pilot. Treat the dashboard as a living system that evolves with new risk vectors, not a one-time deployment.
Comparing dashboard and analytics approaches
When evaluating platforms for retail loss prevention analytics, prioritize integration breadth, deployment speed, and total cost of ownership. McKinsey notes that value capture from AI depends heavily on data infrastructure and integration quality, not just individual analytic features. (Source: McKinsey) The table below compares common architecture approaches.
Evaluation criterion | Spot AI | Traditional VMS | Closed cloud systems |
|---|---|---|---|
Deployment speed | Live in days with existing cameras | Weeks to months | Varies by vendor and hardware requirements |
Hardware compatibility | Camera-agnostic (any IP camera, no vendor lock-in) | May require specific hardware brands | May require proprietary cameras |
AI capabilities | Unified platform with Video AI Agents for security, safety, and operations | Limited, or requires expensive add-ons | Basic analytics included in some tiers |
Integration breadth | Open APIs, webhooks, and MCP endpoint for POS, inventory, and access control | Typically limited to vendor ecosystem | Varies, often restricted to partner integrations |
Scalability | Cloud-native dashboard scales across locations and users | Limited by on-prem server capacity | Scalable, but often with high per-camera licensing |
Investigation speed | Search and resolve incidents in minutes via keyword, behavior, or linked POS exception | Manual scrubbing can take hours per case | Varies by bandwidth and interface design |
Data lineage and auditability | Timestamped, case-ready evidence with full audit trail | Limited metadata and search capability | Varies by platform maturity |
Spot AI offers a unified video AI platform that works with existing and new cameras. Its cloud-native dashboard integrates with enterprise systems through open APIs to deliver the multi-store loss prevention visibility that siloed legacy setups cannot match.
From passive footage to an LP command center
The cameras already mounted in your stores are not just recording devices. They are dormant data sources waiting to become AI teammates that see, reason, and act. A well-designed loss prevention dashboard unifies those cameras with POS exceptions, inventory signals, and compliance data into a single view that drives faster investigations, clearer accountability, and measurable shrink reduction.
For VPs of loss prevention, the strategic shift is straightforward: stop treating video as an archive and start treating it as a high-frequency data feed. When every alert links to timestamped evidence, every anomaly correlates with a video clip, and every store's performance is visible on one screen, the LP function moves from cost center to value driver.
See how Spot AI can turn your existing cameras into an AI-powered loss prevention command center. Book a demo to explore how Video AI Agents, open API integrations, and role-based dashboards work together across your fleet.
Frequently asked questions
What should be on a loss prevention dashboard?
An effective loss prevention dashboard includes five to 15 core KPIs: shrink percentage by store and category, cash variance, refund and void rates, self-checkout exception density, inventory accuracy, average investigation time, and SOP adherence scores. The strongest dashboards also include data quality signals like unexplained inventory variances and systemic adjustment patterns.
How do I integrate POS data with a loss prevention dashboard?
POS integration is typically achieved through open APIs that connect the transaction system with the dashboard platform. This enables exception-based reporting where anomalies like high refunds or frequent overrides are automatically correlated with video footage and inventory records. Prioritize automation and continuous data feeds over one-time integrations to keep the dashboard current.
How do Video AI Agents improve loss prevention reporting?
Video AI Agents analyze camera feeds to detect context-aware behaviors such as loitering, unauthorized zone entry, and unattended checkouts. Each detection feeds into the dashboard as a structured event linked to the associated camera, store, and timestamp. This replaces hours of manual video scrubbing with searchable, case-ready evidence that accelerates investigations.
How should I report loss prevention outcomes to executives?
Use a role-based executive view that focuses on five to seven high-level KPIs, year-to-date trends, and variance from budget. Frame results in financial terms: shrink dollars recovered, investigation hours saved, and compliance improvements. Retailers who scale AI-supported decision-making with clear manager-friendly interfaces have seen EBITDA uplifts in the mid-teens percentage range. (Source: McKinsey)
What is the best way to build a multi-store loss prevention dashboard?
Start with a centralized, cloud-native architecture that aggregates metrics across all locations while allowing drill-down to regional and store-level detail. Use heat maps for geographic risk concentration and role-based views for different audiences. A camera-agnostic, open-API platform ensures you can connect existing hardware and POS systems without rip-and-replace, and most sites can go live in days.
About the author
Sud Bhatija is COO and Co-founder at Spot AI, where he scales operations and go-to-market strategy to deliver video AI that helps operations, safety, and security teams boost productivity and reduce incidents across industries.


.png)
.png)
.png)
.svg)