




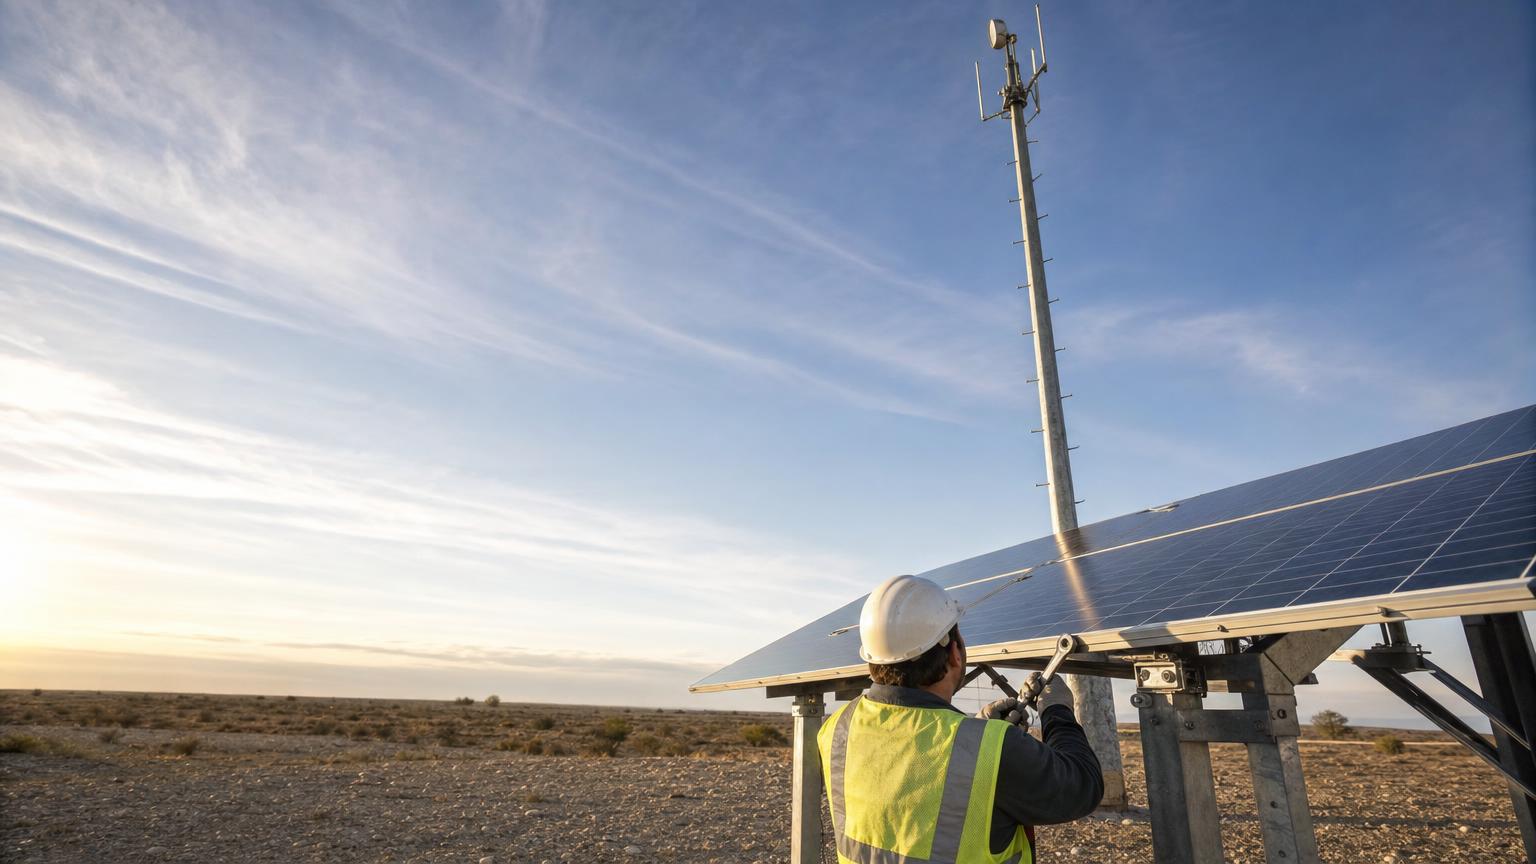


Solar and cellular security trailers: power, connectivity, placement
Sizing a solar security trailer is four numbers in order: the watt-hours it draws in a day, the peak sun hours in the worst month you will run it, the amp-hours that carry the dark stretch, and the megabits the uplink must move. Providers publish panel watts and battery amp-hours, almost nobody publishes the load, and without it neither other number can be checked. Daily global horizontal irradiance at one instrumented site averaged 6.49 kWh/m2/day but ranged from 0.77 to 9.35 across eleven years and roughly 4,000 observations (Source: Frontiers in Artificial Intelligence). Usable battery capacity is a fraction of nameplate too: for lithium iron phosphate cells in cycling service, a 2025 study recommends under 60% depth of discharge (Source: Frontiers in Energy Research). Spot AI sizes deployments from the load upward, and the worked example below exposes every assumption.
Key takeaways
- Spot AI sizes a deployable unit from the load upward: watt-hours per day, then array watts against the design month, then amp-hours, then the uplink.
- The worst month sets the array, never the annual average. The 2,650 Wh per day load below needs about 642 W of panel at 5.5 peak sun hours, and 2,355 W at 1.5.
- Usable capacity is a fraction of nameplate. Three days of autonomy at that load, held to 60% usable depth on a 48 V bank, is about 276 Ah before any cold derate.
- Spot AI's IVR keeps full-resolution video on site and sends only what matters over the link, moving this example from roughly 2.9 TB a month to 8 GB and cutting the radio's share of the power budget.
- Spot AI's detection and deterrence keep working when the uplink drops, because the decision runs at the edge. In one 2026 account breaches finished inside three minutes, against police response of 45 minutes or longer (Source: Security Magazine).
Four inputs to gather first
Deployments that disappoint usually went wrong here. Gather a watt figure for every device at the night condition with infrared illumination running, not daytime idle. Gather the design month, meaning peak sun hours for the coordinates rather than the state, from NREL's PVWatts calculator or the National Solar Radiation Database. Decide the tolerable outage, a business call before an engineering one. Then prove the backhaul actually present with a signal test at mast height.
Step 1: build the power budget in watt-hours per day
Multiply each load's draw by the hours it runs and add the results. That sum is what makes a panel wattage or a battery size mean anything. Every figure below is an assumption.
Load, worked example | Assumed draw | Hours per day | Wh per day |
|---|---|---|---|
Three PTZ cameras, illuminator off | 36 W total | 12 | 432 |
The same cameras, illuminator on | 54 W total | 12 | 648 |
Edge compute and recording | 35 W | 24 | 840 |
Uplink radio, streaming continuously | 25 W | 24 | 600 |
Talk-down and strobe, 20 events at 30 seconds | 60 W | 0.17 | 10 |
Controller and charge controller standby | 5 W | 24 | 120 |
Daily total | 2,650 |
The pitfall. Specification sheets quote daytime idle draw. A camera with illuminator and heater running can pull half as much again, and those are the hours the unit exists for.
Step 2: size the array against the worst month
Divide the daily load by a system derate for required harvest, then by the design month's peak sun hours for array watts. At a 0.75 derate covering charge controller, battery round trip, wiring and soiling, this example needs 2,650 / 0.75, about 3,533 Wh a day.
- 5.5 peak sun hours, a southern summer: about 642 W.
- 3.5, a temperate shoulder season: about 1,010 W.
- 2.5, a northern-tier December: about 1,413 W.
- 1.5, a bad overcast week inside it: about 2,355 W.
At the instrumented site cited above, the best day delivered roughly twelve times the energy of the worst, which is the argument for a design month.
The pitfall. Sizing on the annual mean and treating the shortfall as a battery problem. Storage carries a bad week, not a bad season, because the bank never gets a surplus day.
Measure the load, not the runtime. Ask for draw in watts at night with illumination on and compare it with the panel wattage on the same page. A real irradiance record is a distribution, not a number: the arrays and weather station at latitude 39.1374 degrees north sample more than 360 measurements every second and publish one-minute averages (Source: National Institute of Standards and Technology).
Step 3: size the battery from autonomy and usable depth
Ah = (daily Wh x days of autonomy) / (usable depth of discharge x system voltage)
At three days, 60% usable depth and a 48 V bank, (2,650 x 3) / (0.60 x 48) is about 276 Ah. Two days needs 184 Ah, five days 460 Ah, and halving the bank to 24 V doubles all three. Cold reduces what a bank returns, so a 15% winter derate takes 276 Ah to roughly 325 Ah.
The 60% is not a cautious guess. The 2025 study cited above also recommends ambient below 35 degrees Celsius, having measured deep cycling between 10% and 90% degrading cells 1.65 times faster than shallow cycling over 1,000 cycles.
The pitfall. Treating nameplate amp-hours as usable. A 300 Ah bank inside a sensible window is a 180 Ah bank, and a runtime built on the larger figure is wrong by most of a day.
Step 4: decide whether a generator earns its place
Compute the design-month deficit, then price closing it two ways. Say the mast carries 1,200 W of panel. Through a 1.5 peak sun hour week it harvests 1,200 x 1.5 x 0.75, about 1,350 Wh a day against a 2,650 Wh load, a deficit near 1,300 Wh. Panel alone closes that with another 1,156 W, more than doubling the array. A generator charging at 1.2 kW closes it in 1,300 / 1,200 hours, just over one hour a day, about 32 hours a month.
Panel is capital, silent, and needs no visits. Generator hours are fuel, noise, and a visit that is also a window in which somebody knows the unit is attended. Hybrids win where the design month is short and severe.
The pitfall. Sizing the generator to the load rather than the deficit. Its job is refilling a bank, so charger output and run hours decide it.
Step 5: choose a backhaul class and count the megabits per camera
Estimate the sustained uplink, then pick the class that carries it inside your latency and power envelope. Take a 4 MP stream at 15 frames per second in H.265 averaging 3 Mbps. One camera moves 3 Mbps x 86,400 seconds, or 32.4 GB a day, so three reach about 97 GB a day, roughly 2.9 TB a month per unit. That is a power figure too: a radio transmitting continuously draws far more than one that wakes to send.
Latency separates the satellite classes by geometry. A geostationary satellite sits at 35,786 km, so the path up and back is 71,572 km, and at 300,000 km per second the round trip cannot beat about 480 ms. A low-earth-orbit satellite at 550 km gives a floor near 7 ms, with working networks landing in the tens.
Backhaul class | Latency floor | Terminal power | Where it fits |
|---|---|---|---|
Public cellular LTE or 5G | Tens of ms | Climbs with sustained transmit | The default where a signal test passes |
Private LTE or CBRS | Tens of ms | Moderate, plus the base station | Large compounds, several units |
Point-to-point wireless | Single-digit ms | Low | Within sight of a connected building |
Geostationary satellite | About 480 ms | High and steady | Last resort, and shaped by fair use |
Low-earth-orbit satellite | Near 7 ms | Highest of the five | Remote sites, and what Spot AI customers use where cellular does not reach |
The pitfall. Accepting a coverage map as a signal test. Maps model ground-level signal for a handset, while a unit stands behind steel with its radio on a mast.
Step 6: take the video off the uplink with edge processing
Run detection on the unit and send only detections, clips and telemetry, so the uplink sizes to events rather than hours. Spot AI's IVR keeps full-resolution video in the facility and sends only metadata across the network, which answers the 2.9 TB figure. Reworked that way: metadata at 2 KB an event across 400 events a day is under 1 MB, thirty 20 second clips add about 225 MB, telemetry perhaps 50 MB. The daily total lands near 276 MB, about 8 GB a month against 2.9 TB, a factor of roughly 350.
The power line moves with it. A radio dropping from 25 W of continuous transmit to an 8 W average saves 408 Wh a day, 15% of the budget, cutting the December array from 2,355 W to about 1,993 W. Bandwidth is paid for twice, in data and in watts, and edge processing reduces both.
Spot AI is camera-agnostic over ONVIF, so the unit towed away next quarter shares one system with the fixed cameras at the yard. Silver Bay Seafoods runs the pattern across 22 Alaska locations whose remote facilities reach the platform over Starlink satellite internet, with a customer-reported 15% gain in operational efficiency.
"Some of our facilities are hard to visit on any regular schedule. Spot AI has given us the ability to stay on top of issues at every site, regardless."
Lee Kunkel, Director of Virtual Operations, Storage Asset Management
Step 7: place the unit for sightlines first and sun second
Fix the camera positions the site needs, take the best solar orientation they allow, then quantify the compromise. Pixel density on target is horizontal pixels divided by scene width at that distance, and the DORI thresholds in IEC 62676-4 put recognition at 125 pixels per meter and detection at 25. A 4 MP sensor of 2,688 horizontal pixels behind a 30 degree lens covers a scene 0.536 times the distance wide, so recognition holds to about 40 m and detection to about 200 m. Move the unit 20 m back for sun and you have demoted part of that coverage to detection.
- Face the array true south in the northern hemisphere, not magnetic south.
- Tilt for the design month: where that is December, latitude plus about 15 degrees beats a flatter tilt, and the summer yield it costs was not needed.
- Check the shade arc between 9 AM and 3 PM, which carries most of the harvest, for the season the unit will still be there. A bare tree in March is a canopy in July.
The pitfall. Parking for the sun. A unit angled perfectly at the sky while facing the back of a container stack generates power to watch nothing, and the crew who moved it for morning light will not mention it.
Key terms
- Peak sun hours. The day's solar energy as hours at 1,000 W per square meter, so 4.2 peak sun hours means 4.2 kWh per square meter fell. Array sizing divides by it.
- Usable depth of discharge. The share of nameplate capacity a bank may give up per cycle. The rest is capacity you bought and will not use.
- Backhaul. The link carrying detections, clips and telemetry to the platform, and the first thing to check when a unit goes quiet.
- IVR. Spot AI's Intelligent Video Recorder, the on-site device holding full-resolution video locally while detection runs, which keeps the uplink small.
The pre-deployment checklist
Run this before the unit is towed. Every line has cost somebody a redeployment.
- Night-condition load measured in watts, daily watt-hour total written down.
- Design month peak sun hours pulled for the coordinates, recorded beside the array wattage and derate.
- Bank sized from autonomy, usable depth and voltage, cold derate applied where it freezes.
- Load-shedding order tested by disconnecting the array, not by reading the manual.
- Signal test at mast height at the parking spot, logged in Mbps rather than bars.
- Uplink volume estimated per camera against any data allowance.
- Camera positions fixed on the approaches that matter, pixel density checked at the furthest.
- Shade arc checked for the season the unit will still be there, degraded mode agreed in writing.
Failure modes, and what detection does when they hit
Four things fail here, and a provider who has not described all four is describing a demonstration. The design answers are a shedding ladder that drops streaming first and deterrence last, edge detection with an alert queue, charge-controller telemetry, and deterrence at the unit.
Failure | First symptom | What happens to detection |
|---|---|---|
The bank walks down across a dark week | Voltage sagging lower each morning, then a hard cut | Everything stops at once where no shedding order exists |
The uplink drops or degrades | Alerts stop arriving while the unit looks healthy | Spot AI keeps detecting and deterring at the unit because the decision runs at the edge, and the backlog delivers when the link returns |
Partial shade or soiling | Harvest down a fifth or more, no visible fault | Nothing, until the first failure arrives a week later |
The unit itself becomes the target | Forced entry, cables cut, batteries taken | Only the response that already fired counts |
That last row is not hypothetical. In one metropolitan account, 361 of approximately 5,500 equipment cabinets were breached by forced entry, severed cables and battery removal, typically inside three minutes, against police response often stretching to 45 minutes or longer, with losses above $2 million (Source: Security Magazine). A response whose first hop is a cloud round trip has lost that race, which is why Spot AI drives strobes, horns and natural-conversation talkdown from the detection at the unit, under the AI Security Guard workflow of detect, secure, deter.
Agree the degraded mode in writing before you sign, beside the runtime claim: what the unit still does at reserve voltage, and what it does with the link down.
Power and connectivity settle whether a unit works, not which unit or how many. That decision runs through the mobile security trailer buyer's guide, the rent, lease or buy comparison, the security tower rental guide, parking lot trailer coverage, what a security trailer is, and Spot AI's product overview. To run this arithmetic against your own site, book a demo with Spot AI and bring the device list, coordinates and design month.
Frequently asked questions
How much solar does a security camera trailer need?
Spot AI sizes the array from the load, so the answer is a division rather than a number. Take the daily watt-hours, divide by a system derate of about 0.75, then by the design month's peak sun hours. A 2,650 Wh per day load needs about 642 W at 5.5 peak sun hours and 2,355 W at 1.5.
How long will a solar security trailer run without sun?
Spot AI treats that as a days-of-autonomy decision taken before hardware is chosen. Usable battery energy divided by the daily load gives the answer, and that share sits below nameplate, since a 2025 study recommends under 60% depth of discharge. Three days on a 2,650 Wh per day load is near 276 Ah at 48 V.
How much bandwidth does a security trailer use per camera?
Spot AI's answer turns on whether the video leaves the site. A 4 MP stream at 15 frames per second in H.265 averaging 3 Mbps moves about 32.4 GB per camera per day, so three reach roughly 2.9 TB a month. With Spot AI's IVR keeping full-resolution video on site and sending only detections and clips, the same deployment lands near 8 GB.
Does a security trailer still detect anything when the internet drops?
Spot AI keeps detecting and deterring at the unit through an outage, because detection runs at the edge and the link carries results rather than raw video. What stops is alert delivery, which queues and catches up when the link returns. A unit whose detection runs in the cloud goes blind the moment its radio does.
Where should a solar security trailer be parked on site?
Spot AI's guidance is sightlines first and solar aspect second, then quantify the compromise. Fix the camera positions on the approaches that matter, check pixel density at the furthest, then take the best array orientation those positions allow. Where December is the design month, a tilt near latitude plus 15 degrees wins.
About the author
Amrish Kapoor, VP of Engineering
Amrish Kapoor is VP of Engineering at Spot AI, leading platform and product engineering teams that build the scalable edge-cloud and AI infrastructure behind Spot AI's video AI, powering operations, safety, and security use cases.

